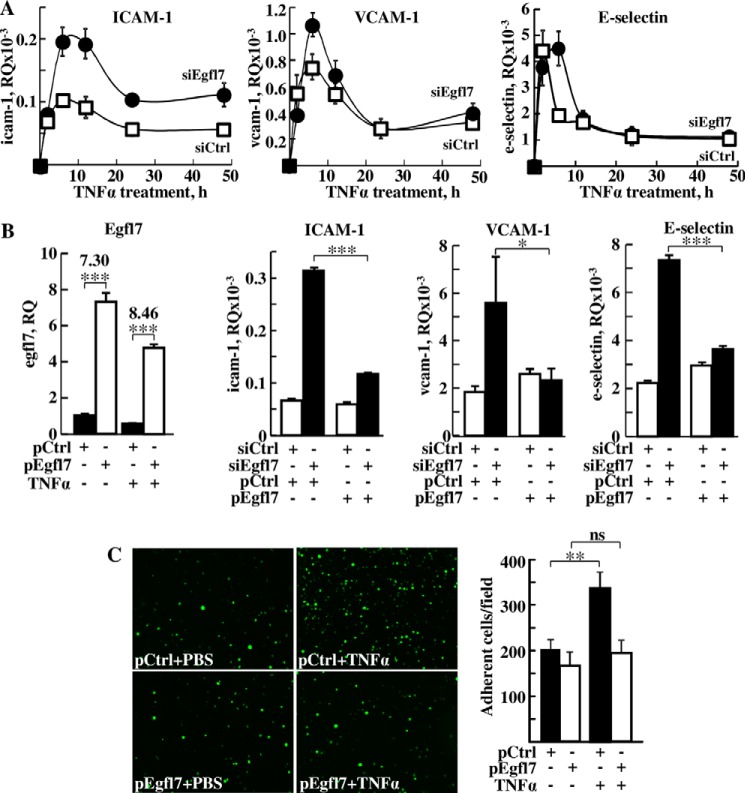
FIGURE 6.
Egfl7 represses the activation of endothelial cells by TNFα. A, expression levels of ICAM-1 (left panel), VCAM-1 (middle panel), and E-selectin (right panel) measured using duplex RT-qPCR in HUVEC transfected with siCtrl (□) or siEgfl7 (●) and stimulated 3 days later with TNFα. The results are representative of two experiments performed in triplicate. At time 0, the levels of Egfl7, ICAM-1, VCAM-1, and E-selectin in the siEgfl7 condition relative to siCtrl condition were 0.31 ± 0.01, 3.18 ± 0.23, 1.00 ± 0.10, and 2.14 ± 0.29, respectively. B, left panel, HUVEC were transfected with pCtrl or pEgfl7 and treated or not for 6 h with TNFα and expression levels of Egfl7 assessed by RT-qPCR on triplicate experimental samples. The numbers indicate the pEgfl7/pCtrl ratio of Egfl7 expression. ***, p < 0.001. Right three panels, HUVEC were transfected with siCtrl or siEgfl7, rescued with pCtrl or pEgfl7, and stimulated or not 2 days later with TNFα for 6 h. Expression levels of ICAM-1, VCAM-1, and E-selectin were assessed by duplex RT-qPCR on triplicate experimental samples. *, p < 0.05; ***, p < 0.001. C, left panel, adhesion of fluorescently labeled Jurkat T-lymphocytes plated onto monolayers of HUVEC transfected 2 days earlier with pCtrl or pEgfl7 and stimulated or not with TNFα. The results are representative of two experiments performed in triplicate. Right panel, mean numbers of adherent fluorescent cells counted over 10 microscopic fields in each condition. *, p < 0.05; ns, non-significant

