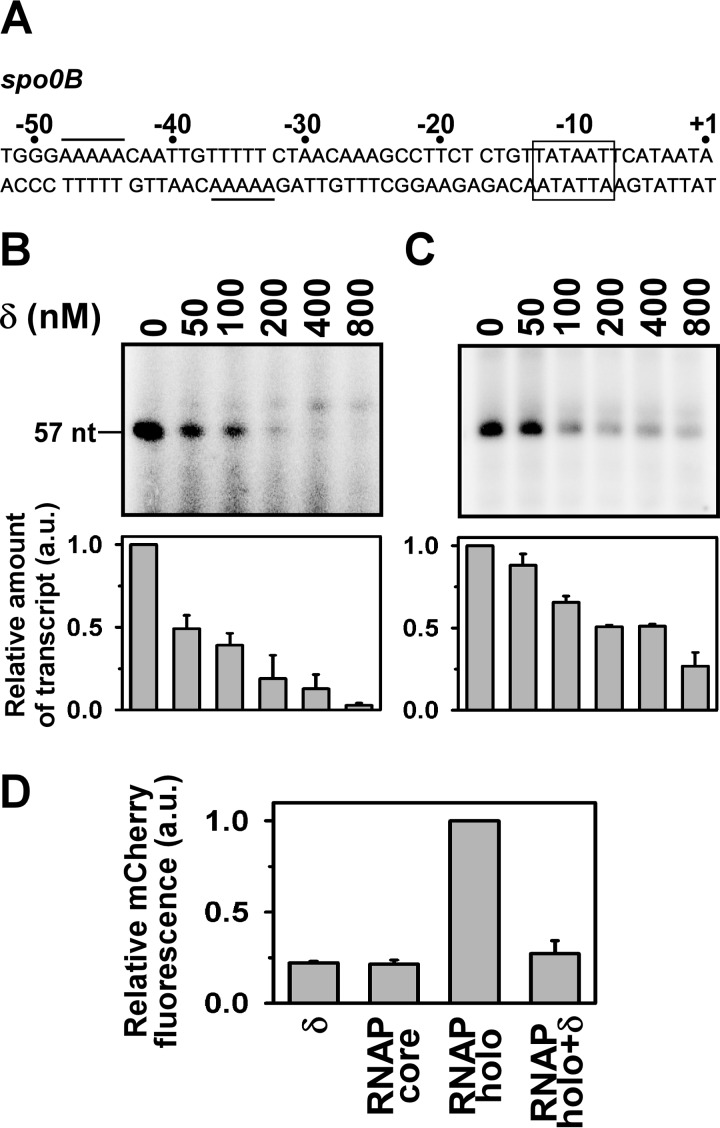
FIGURE 1.
δ represses the spo0B promoter. A, nucleotide sequence of spo0B promoter DNA (−52/+1): the rectangular box represents the −10 element, the putative δ binding site is underlined. B, in vitro transcription assay: δ was incubated with promoter DNA in transcription buffer at 25 °C for 15 min prior to open complex formation. Open complex was formed by addition of 400 nm RNAP holo at 37 °C for 20 min. Transcription reaction was initiated with addition of NTP (final concentrations: 250 μm ATP, GTP, and UTP, and 25 μm [α-32P]CTP (0.2 μCi)). Run-off transcript size is 57 nt. Each experiment was repeated three times and the mean fold-decrease in the amount of transcript at each concentration of δ with respect to the amount in the absence of δ were plotted as a bar graph (shown below of each panel). C, same as in B, but δ was incubated for 10 min once the open complex was formed. D, in vivo recombinant reporter assay; three-plasmid expression system in E. coli. The bars represent relative mCherry fluorescence of E. coli cells containing the pFPVmCherry-spo0B and plasmids encoding (i) δ (pAcYcDuet-rpoE), (ii) BsRNAP core (pNG219), (iii) BsRNAP holo (pNG219 + pAcYcDuet-rpoD), and (iv) BsRNAP holo + δ (pNG219 pAcYcDuet-rpoD-rpoE). DNA fragments (−105/+12) of spo0B were inserted upstream of the mCherry gene. Each set of assay was repeated three times, and the mean values of relative mCherry fluorescence of the cells were plotted. Fluorescence of the cells containing BsRNAP holo were normalized to 1.

