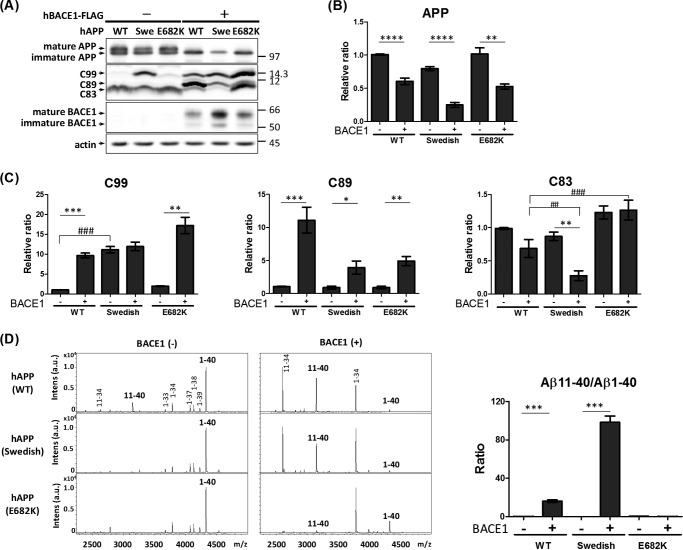
FIGURE 6.
Elevated BACE1 activity cleaves hAPP at the β′-site to decrease the level of Aβ(1-XX), even if hAPP harbors FAD mutations. A, protein levels of APP, APP CTFs, and BACE1 in cells. N2a cells expressed hAPP with or without FAD mutation in the presence (+) or absence (−) of BACE1-FLAG expression. Cell lysates (10 μg of protein) were analyzed by Western blotting with anti-APP, anti-FLAG, and anti-actin antibodies. hAPP (first row), CTFβ/C99, CTFβ′/C89, and CTFα/C83 (second row), BACE1 (third row), and actin (fourth row) are indicated. Numbers indicate molecular size markers (in kDa). B, the levels of APP are indicated as ratios relative to the levels of hAPP (WT) without BACE1 expression, which was assigned a reference value 1.0. Statistical analysis was performed by Student's t test. p values are provided for the comparison with the APP without (−) BACE1 expression (mean ± S.E., n = 6; **, p < 0.001; ****, p < 0.0001). C, the levels of APP CTFs are indicated as ratios relative to the levels of hAPP without BACE1 expression, which was assigned a reference value 1.0. Statistical analysis was performed by Student's t test. p values are provided for comparison with the CTF without (−) BACE1 expression (mean ± S.E., n = 6; *, p < 0.05; **, p < 0.01; ***, p < 0.001). In another case, statistical analysis was performed using Dunnett's multiple comparison test. p values are provided for comparison with the hAPP wild-type (WT) (mean ± S.E., n = 6; ##, p < 0.001; ###, p < 0.001). D, representative MS spectra of Aβ with amino-terminal β- and β′-cleavage sites generated from innate hAPP (WT) or hAPP harboring the Swedish (middle) or E682K FAD mutation. Culture media of cells expressing wild-type hAPP (upper), hAPP Swedish (middle), and hAPP E682K (lower) in the presence (right) and absence (left) of BACE1 expression were analyzed by IP-MS. Aβ(1-XX) is the product of cleavage at the β site, whereas Aβ(11-XX) is the product of cleavage at the β′-site. Changes of the Aβ(11–40)/Aβ(1–40) ratio from hAPP harboring FAD-associated mutations. The Aβ(11–40)/Aβ(1–40) ratios were indicated as a relative ratio and compared with (+) or without (−) overexpression of BACE1. Statistical significance was determined by Student's t test (n = 3), and p values are indicated (***, p < 0.001). Data are shown as mean ± S.E.

