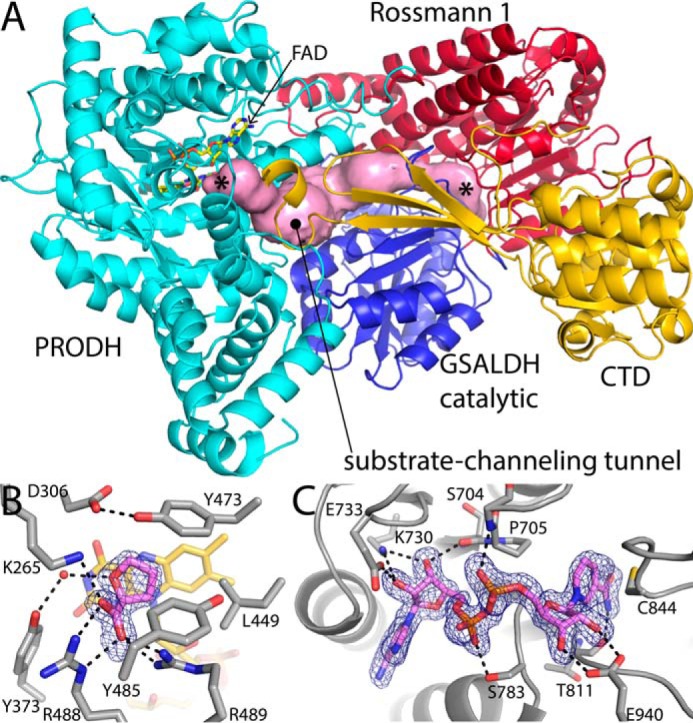
FIGURE 2.

Structure of SmPutA. A, cartoon drawing of the protomer. The PRODH module is colored cyan. The Rossmann NAD+-binding and catalytic domains of the GSALDH module are colored red and blue, respectively. The CTD is colored gold. The pink surface represents the substrate-channeling tunnel. The asterisks indicate the locations of the two active sites in the tunnel, with the PRODH site on the left and the GSALDH site on the right. B, electron density and interactions for the proline analog THFA bound to the SmPutA PRODH active site (space group P21, chain A). The cage represents a simulated annealing σA-weighted Fo − Fc omit map (3.0 σ). C, electron density and interactions for the NAD+ bound to SmPutA (space group P21). The cage represents a simulated annealing σA-weighted Fo − Fc omit map (3.0 σ).
