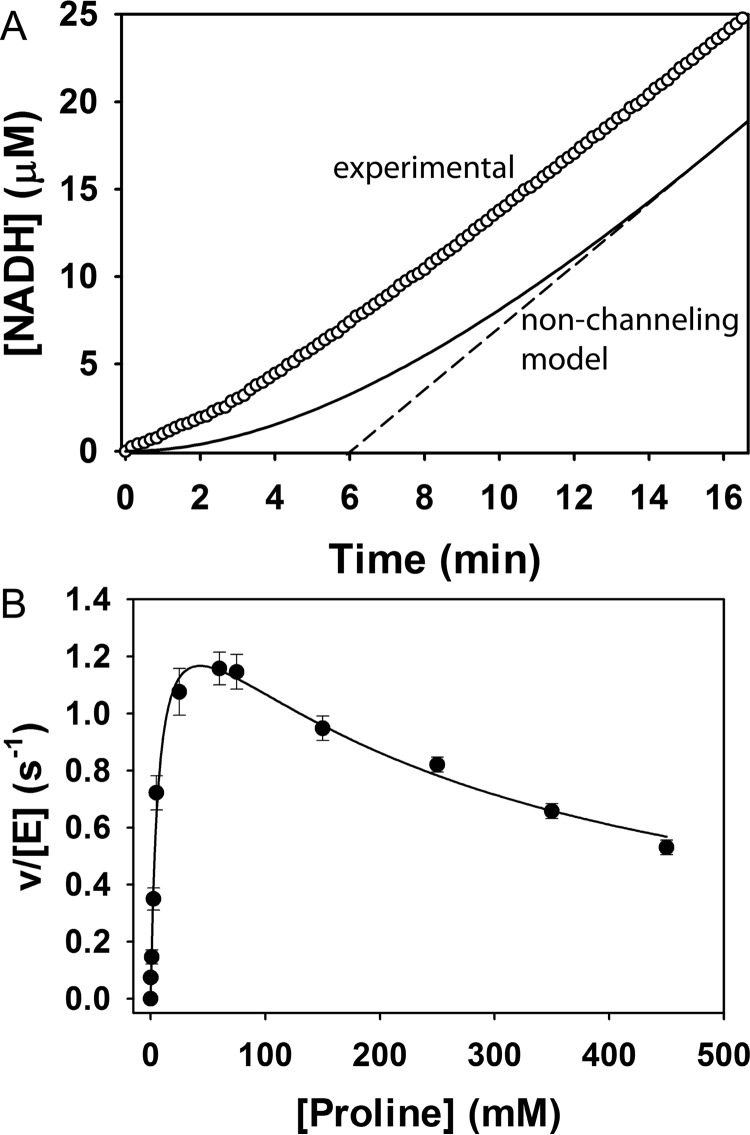
FIGURE 7.
Kinetics of substrate channeling. A, transient time analysis of SmPutA. The circles show NADH production from SmPutA (0.25 μm) with 40 mm proline, 200 μm CoQ1, and 200 μm NAD+, pH 7.5. The solid curve shows the predicted NADH formation using a two-enzyme nonchanneling model of the SmPutA PRODH-GSALDH coupled reaction (Equation 1). Linear extrapolation of the nonchanneling model as shown by the dashed line yields a transient time of 6 min. B, initial velocity of the coupled PRODH-GSALDH reaction with varied proline concentration and fixed CoQ1 (300 μm) and NAD+ (200 μm). Non-linear least squares fit of the data to a substrate inhibition model as shown gave best fit parameters of kcat = 1.6 ± 0.1 s−1, Km = 7 ± 1 mm, and Ki = 263 ± 36 mm proline.

