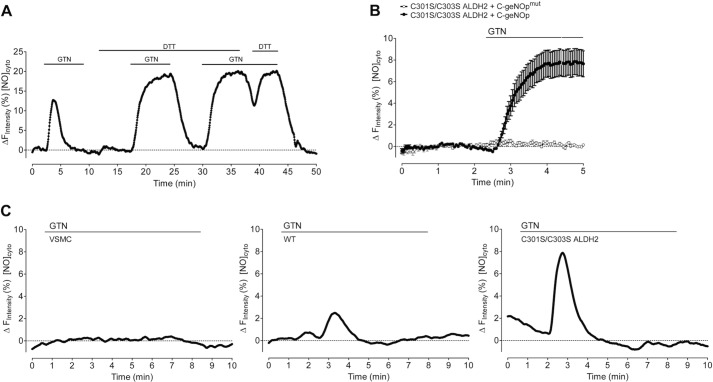
FIGURE 3.
Live-cell imaging of GTN-derived NO formation in the absence of DTT and determination of the specificity of the NO sensor using C-geNOpmut.A, representative curve showing the effect of 1 mm DTT on intracellular NO dynamics in VSMC expressing C301S/C303S ALDH2 in response to 1 μm GTN. [NO]cyto, free NO concentration. B, average curves showing fluorescence over time of C-geNOp (n = 12) and C-geNOpmut (n = 10) upon the addition of 1 μm GTN to vascular smooth muscle cells expressing C301S/C303S ALDH2. Data represent average values ± S.E. C, representative curves showing NO release over time in VSMC infected with C-geNOp alone (left panel) or in combination with either WT (middle panel) or C301S/C303S ALDH2 (right panel) in response to 1 μm GTN in the absence of DTT. Data are expressed as inverted curves (1 − F/F0 in %) of the number of experiments indicated in the panel description above.

