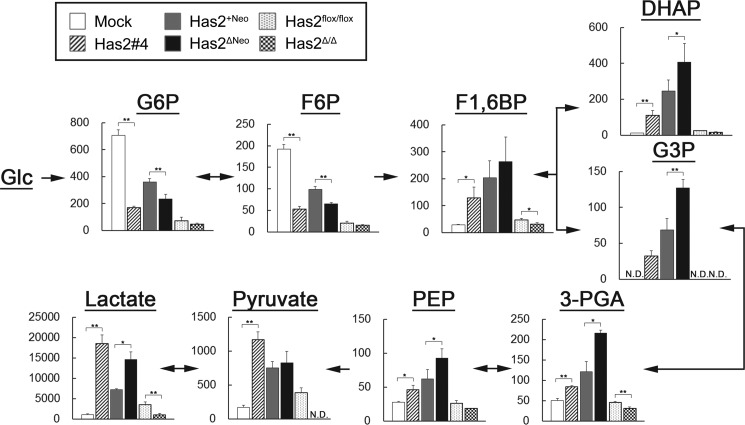
FIGURE 3.
Metabolomic analysis of glycolytic intermediates in Has2-overexpressing and -deficient breast cancer cells. Has2-overexpressing and -deficient cancer cells were extracted and subjected to CE-MS analysis for G6P, F6P, F1,6BP, DHAP, G3P, 3-phosphoglycerate (3-PGA), phosphoenolpyruvate (PEP), pyruvate, and lactate. Mock (open bars), Has2 #4 (striped bars), Has2+Neo (gray bars), Has2ΔNeo (black bars), Has2flox/flox (dotted bars), and Has2Δ/Δ (checkered bars) cells are shown. Metabolite concentrations (pmol/106 cells) were superimposed on a glycolytic pathway map. N.D., not detected. Data represent the mean ± S.D. (error bars) of three independent experiments. All p values were evaluated by the Wilcoxon matched pair test. *, p < 0.05; **, p < 0.01.

