FIGURE 3.
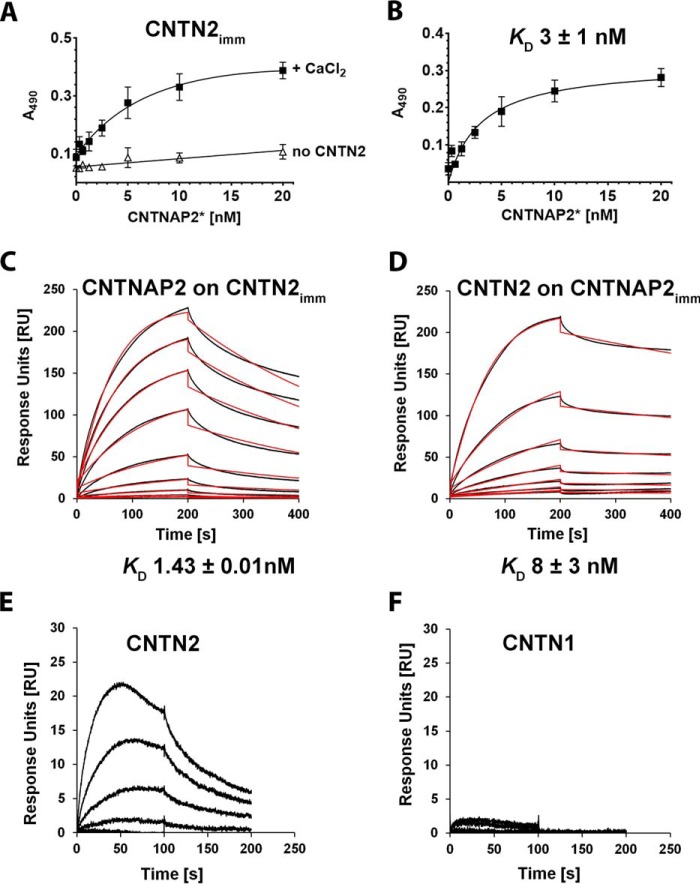
Binding between CNTNAP2 and CNTN2 ectodomains. A, increasing concentrations of biotinylated CNTNAP2* were incubated in wells with immobilized CNTN2 in presence of 5 mm CaCl2 (■) or in wells lacking CNTN2 (▵). B, specific binding, expressed as the total binding in the presence of Ca2+ minus the binding in the absence of CNTN2. Error bars, S.E. C, binding of soluble CNTNAP2 to a CNTN2-coupled sensor by SPR. Binding curves of CNTNAP2 (0.125–10 nm) (in black) were fit to a 1:1 binding model (red). D, binding of soluble CNTN2 to a CNTNAP2-coupled sensor by SPR. Binding curves of CNTN2 (1.56–200 nm) (black) were fit to a 1:1 binding model (red). E and F, side-by-side comparison of CNTN2 and CNTN1 binding to a single CNTNAP2-coupled sensor by SPR.

