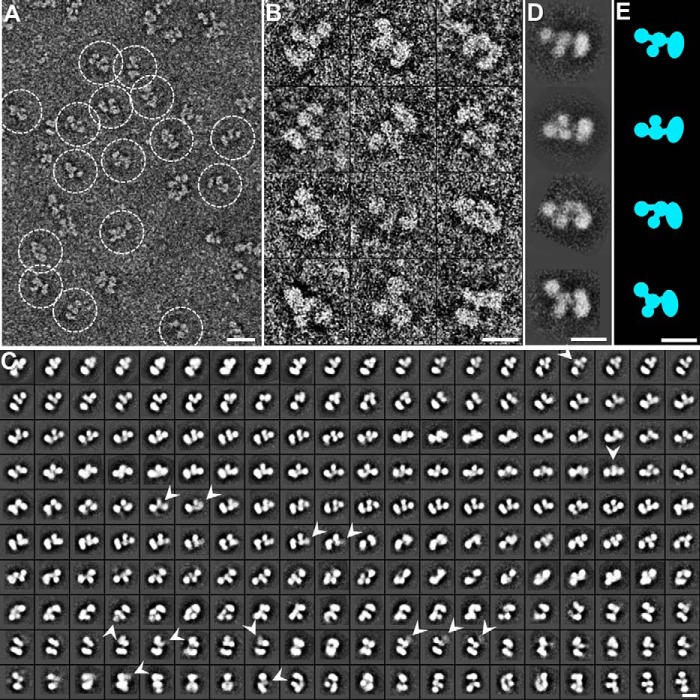
FIGURE 4.
Negative staining EM images and reference-free class averages of CNTNAP2. A, survey view of CNTNAP2 particles prepared by optimized negative staining. B, 12 representative particles of CNTNAP2. C, all 200 reference-free class averages calculated from 53,774 particles picked from 1,392 micrographs. In some class averages, a domain is fuzzy, probably due to flexibility and the dynamics of the protein (arrowheads). D, four selected reference-free class averages of the particles. E, schematic of particles corresponding to D. Scale bar, 200 Å (A) and 100 Å (B–E).

