FIGURE 7.
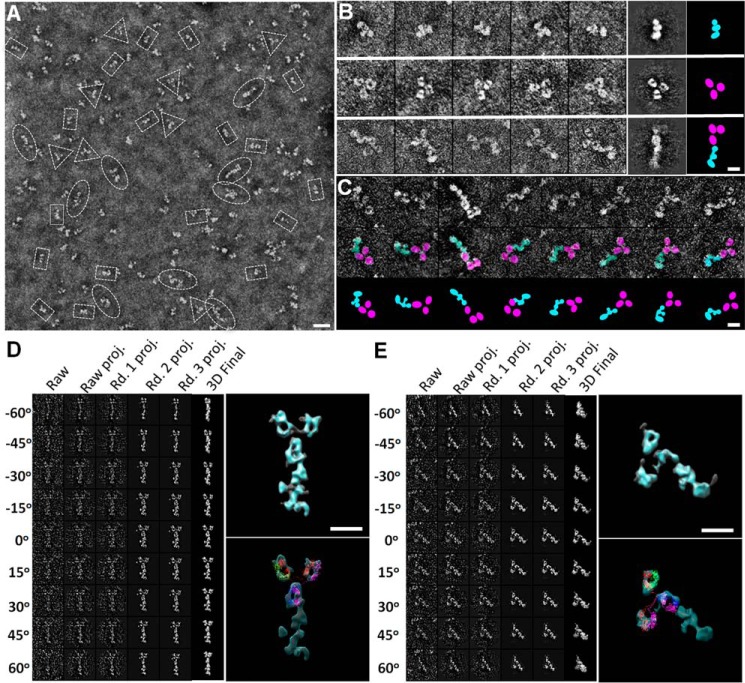
Identification of the C-terminal end of CNTNAP2 by monoclonal antibody K67/25. A, survey NS-EM view of CNTNAP2 in complex with the monoclonal antibody K67/25. The ratio of particles observed was ∼74 ± 6% CNTNAP2 (rectangles), ∼13 ± 4% antibody (triangles), and ∼13 ± 3% complex (ovals). B, representative CNTNAP2 particles (top), antibody particles (middle), and CNTNAP2-antibody complexes (bottom). The last two columns show the representative reference-free class averages and corresponding schematic. C, series of CNTNAP2-antibody complexes indicating the range of conformational heterogeneity (top) and schematic representations (bottom). D, process to generate a representative 3D density map from a targeted CNTNAP2-antibody complex using IPET. Final IPET 3D density map of a single CNTNAP2-antibody complex shown in the top right panel. Final 3D density map overlaid with an IgG antibody (Protein Data Bank code 1IGT) is shown in the bottom panel. During docking, the linkers between the Fab and Fc domains were allowed to flex. E, process to generate another representative 3D density map from a targeted CNTNAP2-antibody complex using IPET as performed in D. Scale bar, 200 Å (A) and 100 Å (B, C, D, and E).

