FIGURE 2.
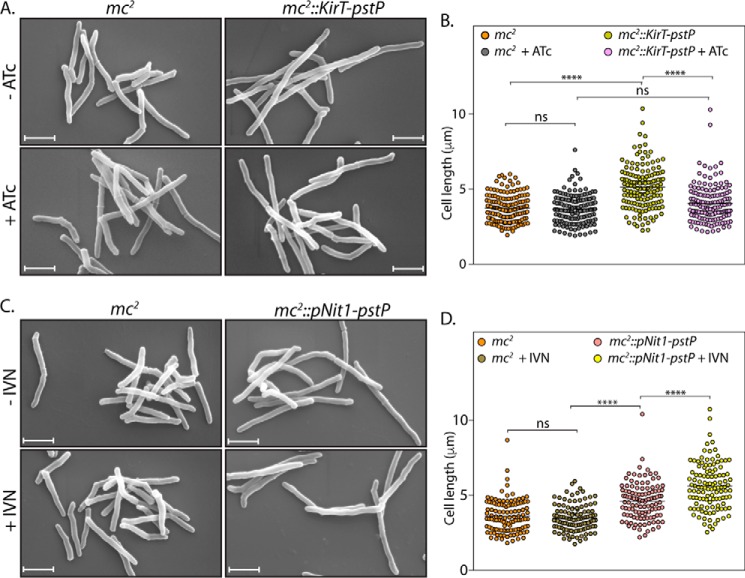
Impact of overexpression of PstP on morphology. A, mc2 or mc2::KirT-pstP cultures were seeded at 0.1 and allowed to grow in the presence and absence of 50 ng/ml ATc inducer for 12 h. Cells were processed for SEM as described under “Materials and Methods.” Scale bar, 1 μm. B, cell lengths of 150 individual cells from different SEM images were measured using Smart Tiff software, and data were analyzed using GraphPad Prism version 6. Mean lengths are plotted, and significance is calculated using ordinary one-way ANOVA with p < 0.0001 (****). Mean lengths of mc2, mc2 +ATc, mc2::KirT-pstP −ATc, and mc2::KirT-pstP +ATc were 3.74, 3.68, 5.13, and 4.03 μm, respectively. C, mc2 or mc2::pNit1-pstP cultures were initiated at an A600 of 0.1 in the absence or presence of 5 μm IVN and grown for 12 h. SEM was performed as described. Scale bar, 1 μm. D, cell lengths of 115 individual cells from SEM images were measured by Smart Tiff software and analyzed as mentioned in B. Mean cell lengths of mc2, mc2 +IVN, mc2::pNit-pstP −IVN, and mc2::pNit1-pstP +IVN samples were 3.61, 3.49, 4.60, and 5.61 μm, respectively. ****, p < 0.0001, ordinary one-way ANOVA. ns, not significant.

