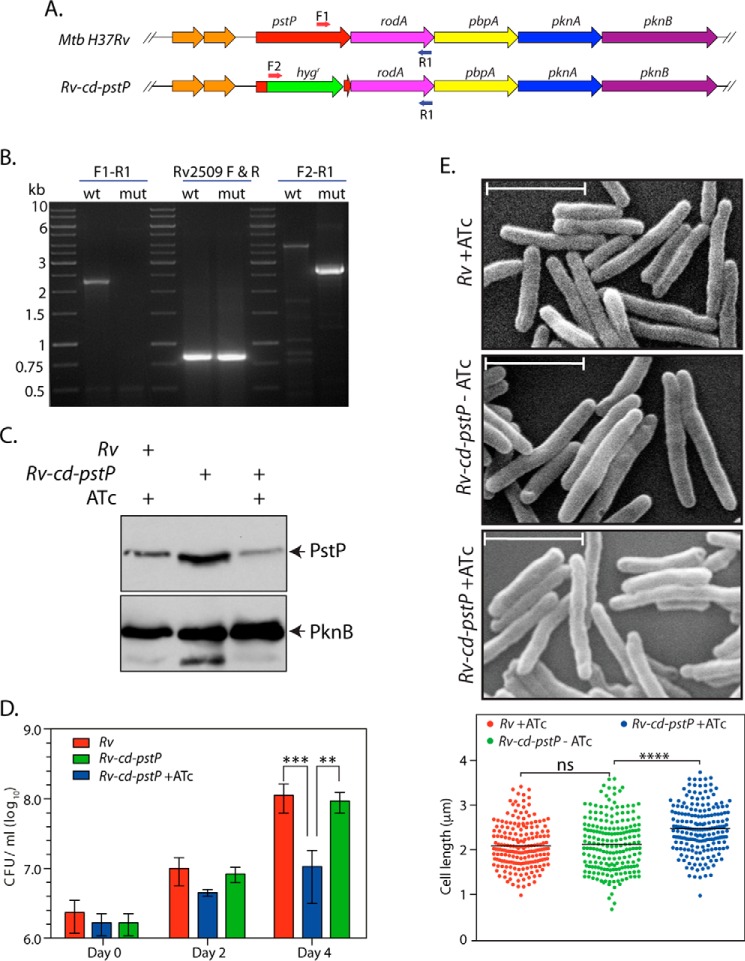
FIGURE 4.
Decrease in PstP expression compromises M. tuberculosis growth. A, schematic representation of Rv and Rv-cd-pstP mutant. The primers used for PCR-based confirmation of the generated mutant are depicted by arrows. B, agarose gels showing the PCR amplicons obtained using genomic DNA from Rv (wt) and Rv-cd-pstP (mut). The left panel depicts PCR using primer F1-R1 wt (2.265 kb) and F1-R1 mut (no amplicon). The middle panel depicts control PCR using Rv2509 F-R primers. The right panel depicts PCR with F2-R1 wt (no amplicon) and F2-R1 mut (2.61 kb). C, Rv and Rv::cd-pstP cultures were initiated at an A600 of 0.1 and grown in the absence or presence of ATc (1 μg/ml) for 4 days. WCLs were prepared and analyzed by Western blot with α-PstP and α-PknB antibodies. D, Rv and Rv::cd-pstP cultures initiated at an A600 of 0.1 were grown in the presence or absence of ATc for 0, 2, or 4 days. Cultures were serially diluted and plated on 7H10 agar plates supplemented with OADC without ATc. Mean log10 cfu for cultures on day 4 were 8.04 cfu for Rv, 7.9 cfu for Rv::cd-pstP −ATc, and 6.0 cfu for Rv::cd-pstP +ATc. The experiment was performed in triplicate, and mean values with S.D. were been plotted using GraphPad Prism version 6. Significance was calculated using two-way ANOVA with p < 0.001 (***) and p < 0.01 (**). E, SEM analysis of Rv, Rv::cd-pstP −ATc, and Rv::cd-pstP +ATc cultures grown for 4 days. Scale bar, 1 μm. F, 198 cells of each cell type were visualized by SEM and measured per sample with the help of Smart Tiff software. Mean cell lengths for Rv, Rv-cd-PstP −ATc, and Rv-cd-PstP +ATc samples were 2.09, 2.12, and 2.47 μm, respectively. Data were plotted using GraphPad Prism version 6, and significance was calculated using two-way ANOVA with p < 0.0001 (****). ns, not significant.

