FIGURE 7.
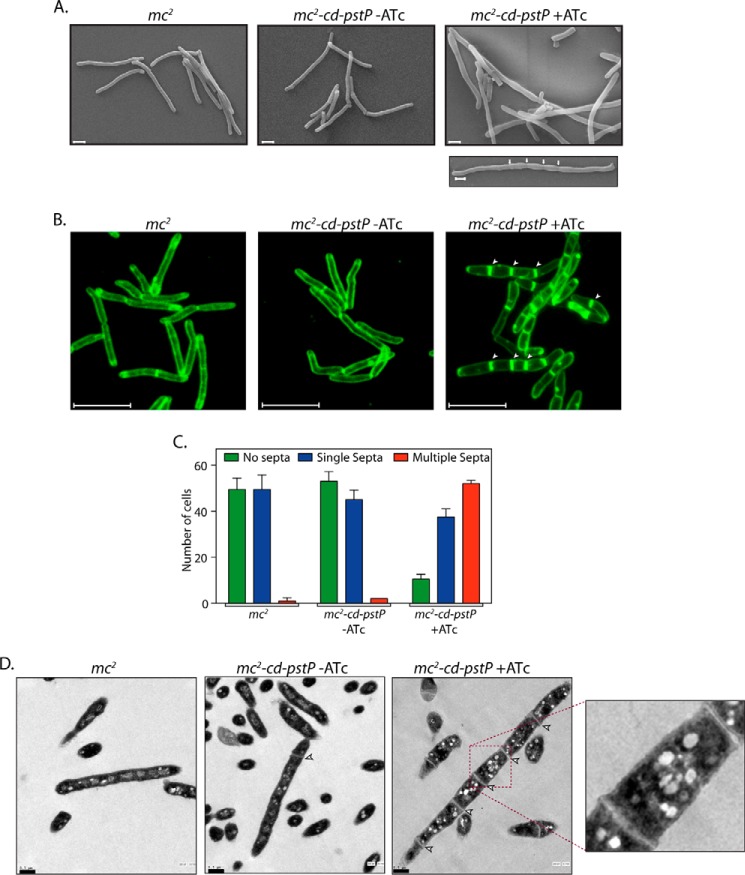
Depletion of PstP results in multiseptum phenotype. A, SEM analysis of mc2 and mc2::cd-pstP strains grown in the absence or presence of ATc (50 ng/ml) for 12 h was performed as described (50). White arrows in the bottom right panel indicate septa. Scale bar, 1 μm. B, FM4-64 labeling and microscopy of mc2 and mc2::cd-pstP strains grown in the absence or presence of ATc was performed as described under “Materials and Methods.” The arrows indicate the presence of septa. Scale bar, 5 μm. C, 100 individual cells per cell type per FM4-64 labeling experiment were scored for aseptate, uniseptate, or multiseptate phenotypes. The experiment was performed twice, and the average is represented in the graph. D, TEM analysis of mc2 and mc2::cd-pstP strains grown in the absence or presence of ATc for 12 h. Processed samples were visualized on grids under FEI G2 Spirit. Scale bar, 0.5 μm. Error bars, S.D.

