FIGURE 1.
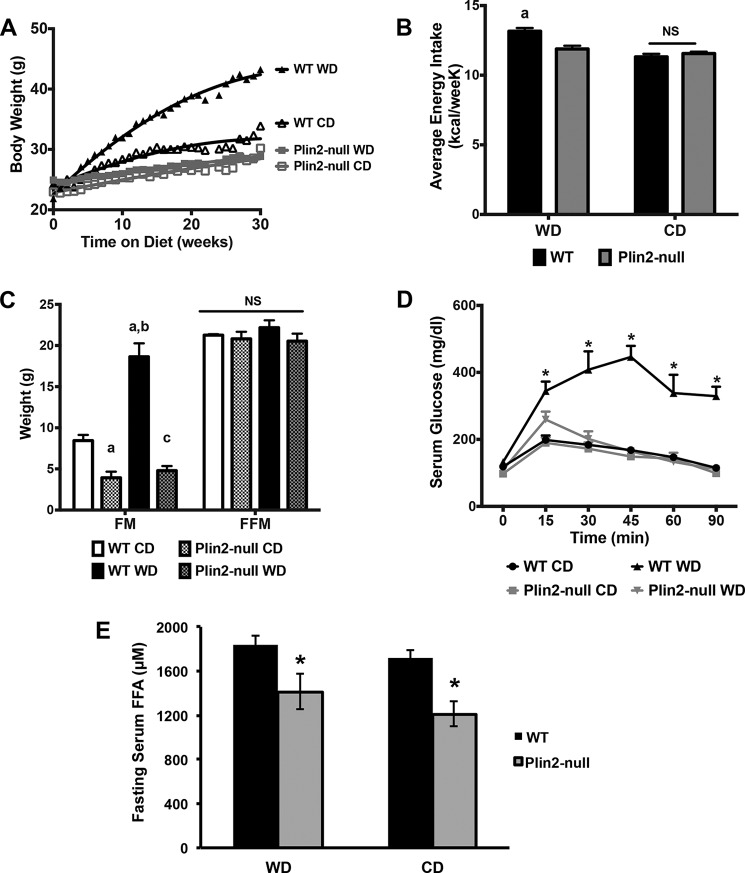
Plin2-null mice are protected from obesity and insulin resistance on Western diet. A, weight gain curves for WT and Plin2-null mice fed Western diet (WD) or control (CD) diets. B, average weekly energy consumption for WT and Plin2-null mice fed CD or WD for 30 weeks. a indicates significantly (p < 0.001, two-way ANOVA) increased average energy consumption by WD-fed WT mice compared with the other groups. C, body compositions of WT and Plin2-null mice fed WD or CD for 30 weeks. FM, fat mass; FFM, fat-free mass. a, indicates fat mass values are different from CD-fed WT mice (p < 0.05, two-way ANOVA); b, indicates fat mass values are different from CD-fed WT mice and CD- or WD-fed Plin2-null mice (p < 0.001, two-way ANOVA). D, glucose tolerance tests for WT and Plin2-null fed WD or CD at 30 weeks. Asterisks indicate significantly elevated serum glucose levels in WD-fed WT mice compared with the other groups, p < 0.05, two-way ANOVA. E, 18-h fasting serum free fatty acid (FFA) levels in WT and Plin2-null mice fed Western and control diets. Asterisks indicate significantly reduced serum FFA levels in Plin2-null mice, p < 0.05, Student's t test. NS, not statistically different.

