FIGURE 5.
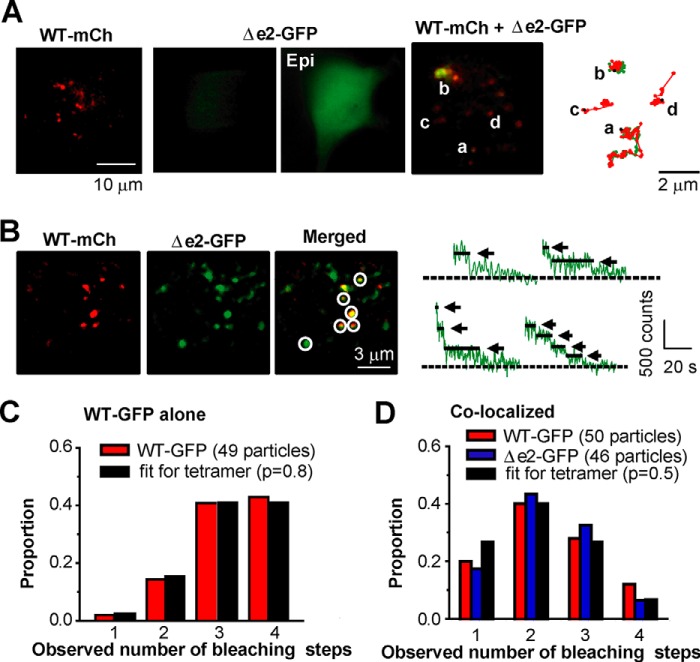
The BKαΔe2 splice variant can form hetero-tetramer with BKαWT. A, TIRF images from cells expressing WT-mCh, Δe2-GFP, or both (cells were transfected with cDNA at a ratio (WT-mCh:Δe2-GFP) of 1:1). Integrated fluorescence signals taken at 60 s (right). Signals from GFP or mCh are illustrated by green and red, respectively. Epi indicates an image obtained using epifluorescence microscopy. B, TIRF images of cells expressing WT-mCh and Δe2-GFP. Co-localized signals are indicated by circles. Traces of GFP fluorescence upon sequential excitation are shown in the right panels. Arrows and dotted lines denote bleaching steps and the basal levels, respectively. Cells were transfected with cDNA at a ratio (GFP:mCh) of 1:1. C, summary of frequency distributions of the number of WT-GFP bleaching steps measured in HEK293 cells transfected with WT-GFP and WT-mCh (49 spots from 6 cells). Here WT-GFP spots detected alone (not with WT-mCh) were analyzed. Note that the distribution is similar to theoretical frequency distribution assuming (i) WT-GFP homo-tetramers (n = 4) and (ii) the apparent probability of GFP being fluorescent (p) as 0.8 (fit for tetramer). D, frequency distributions of the number of bleaching steps in co-localizing WT-GFP (red) or Δe2-GFP (blue) (50 and 46 particles from 5 and 6 cells, respectively). Cells were transfected with cDNA at a ratio (GFP:mCh) of 1:1. Note that in both cases the distributions show the peaks at 2, and these were well fitted to the binomial distribution with n = 4 and p = 0.5.

