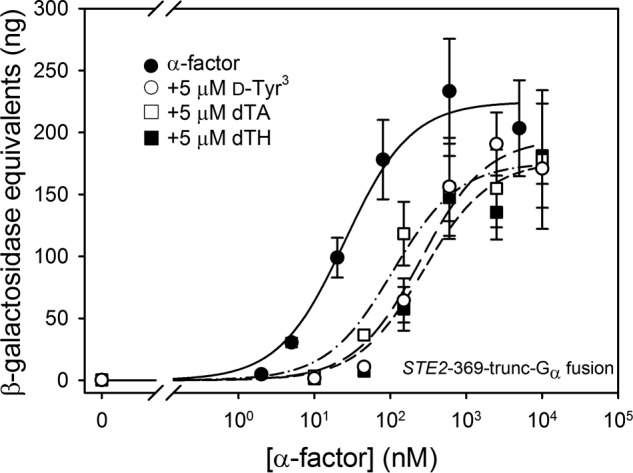
FIGURE 14.

Signaling responses to agonist and antagonist mixtures in a strain expressing ste2-trunc-369-Gα (Ste2p truncated after residue 369 and fused to Gα) from the chromosome (A4881) (see also Table 9). Signaling responses to mixtures of increasing concentrations of agonist and 5 μm d-Tyr3 (open circles), 5 μm dTA (open squares), or 5 μm dTH (closed squares) are shown, and responses to agonist alone are shown by filled circles.
