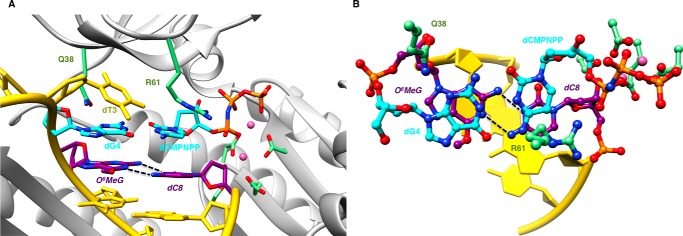
FIGURE 5.
Sheared configuration of primer dC and O6-MeG in a hpol η extension stage complex. A, the active site viewed into the DNA major groove. B, rotated by ∼90° around the horizontal axis and viewed perpendicular to the base planes of dCMP-NPP and dG. Selected active site residues are colored by atom with carbon atoms shown in purple (O6-MeG and dC at the −1 position), cyan (nascent dG:dCMP-NPP pair), or green (Arg-61 and Gln-38 from the finger domain as well as Asp/Glu coordinated to Mg2+ (pink spheres)). The remaining nucleotides are shown in yellow, and H-bonds involving the adducted residue are depicted as dashed lines.

