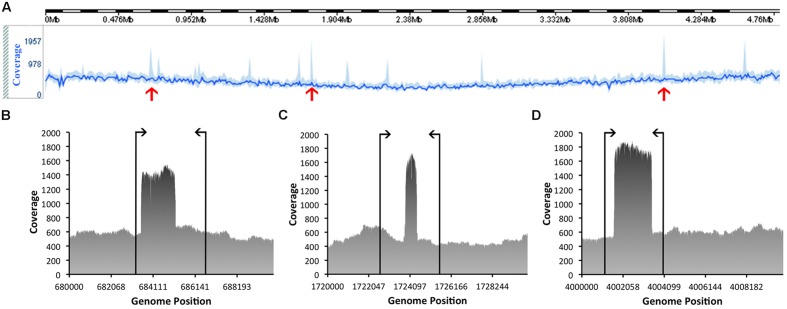
FIGURE 4.
Coverage information related to the assembly of the genome of C. estertheticum DSM 8809. The line in bright blue (A), located toward the top of the figure, represents the average sequence coverage of each window, denoted as (B–D) consisting of 10,000 bp and the area in lighter blue indicates the maximum and minimum coverage of the window. Spikes marked with red arrows highlight those regions referred to in the text and which were subsequently checked by PCR to validate the true nature of the consensus sequence. Annealing positions of the PCR primers are indicated by vertical lines, as shown for (B–D).

