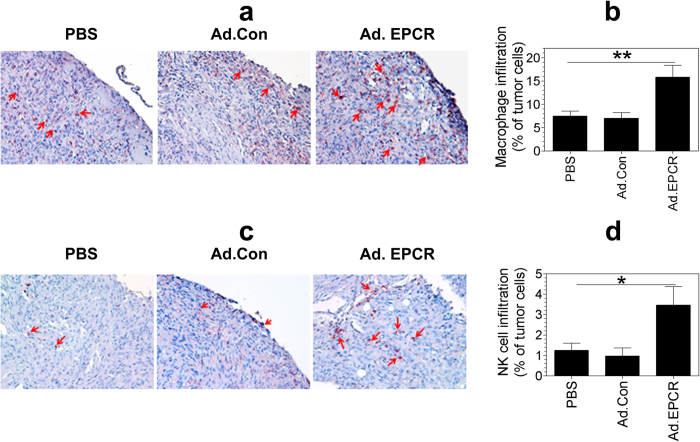
Figure 7. Transduction of EPCR expression in MPM recruits macrophages and NK cells into tumor environment.
Nu/J nude mice were implanted with REN MPM cells and 10 days following the tumor cell implantation, mice were treated with PBS, control adenovirus or adenovirus encoding EPCR for 20 days as described in Fig. 4. At the end of the 30-day experimental period, tumors were removed and processed for tissue sectioning. Tissue sections were stained for the expression of mouse macrophage marker F4/80 (a) or NK cell marker NK1.1 (c). The percentage of macrophages and NK cells in tumors was determined by counting the number of cells stained positive for either F4/80 or NK1.1 in a field and the number of tumor cells present in that field. Images shown in panels (a,c) are representative images. Cells stained with red color indicate macrophages (a) and NK cells (c; also identified by arrows). Data shown in panels (b,d) were obtained by counting the number of positively stained cells and the total number of tumor cells in 20 to 25 randomly selected fields from 5 or more tumors derived from different mice. *p < 0.05; **p < 0.01.

