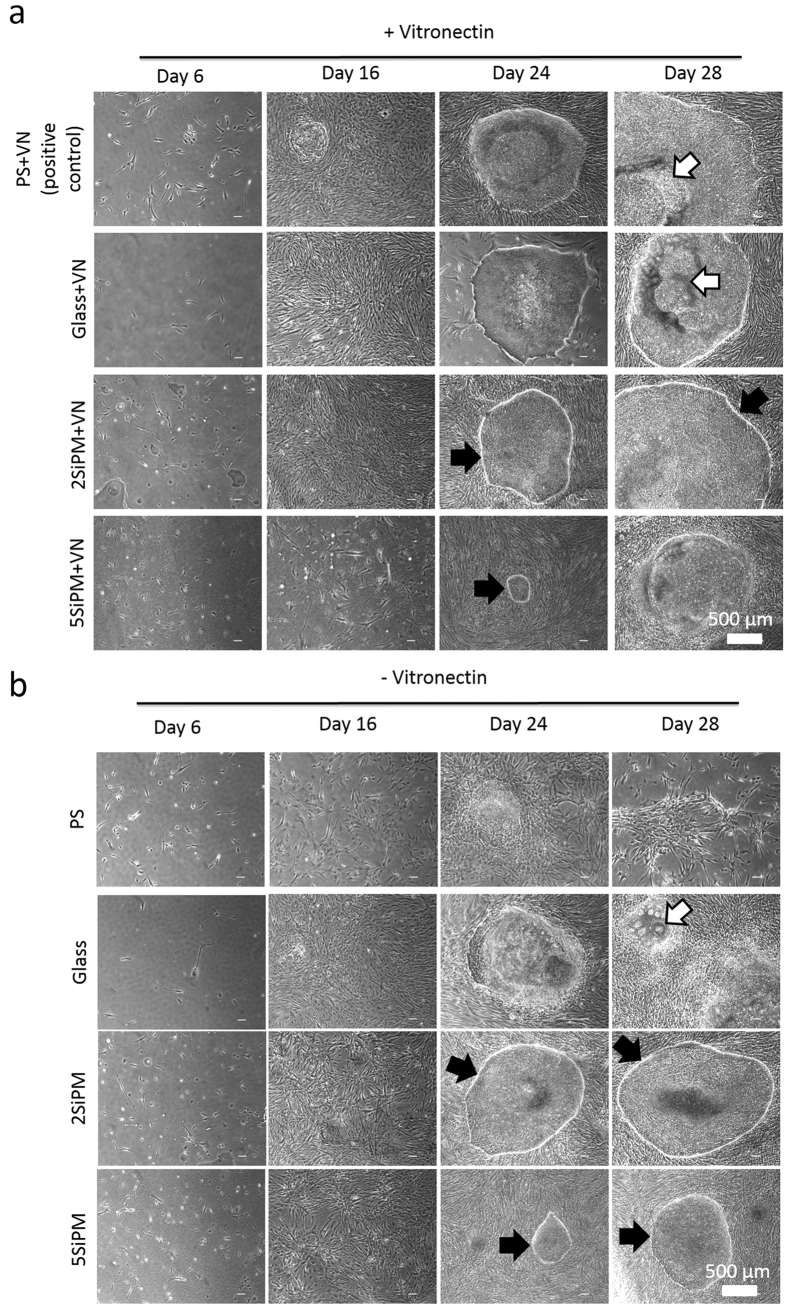
Figure 4. Cell morphology during reprogramming.
Representative morphologies are shown at different time points during cell reprogramming on surfaces coated (a with or b) without vitronectin (VN). PS+VN is the positive control. White arrows indicate differentiated cells within hiPSC colonies, while black arrows indicate fully reprogrammed hiPSC colonies with a defined cell boundary.

