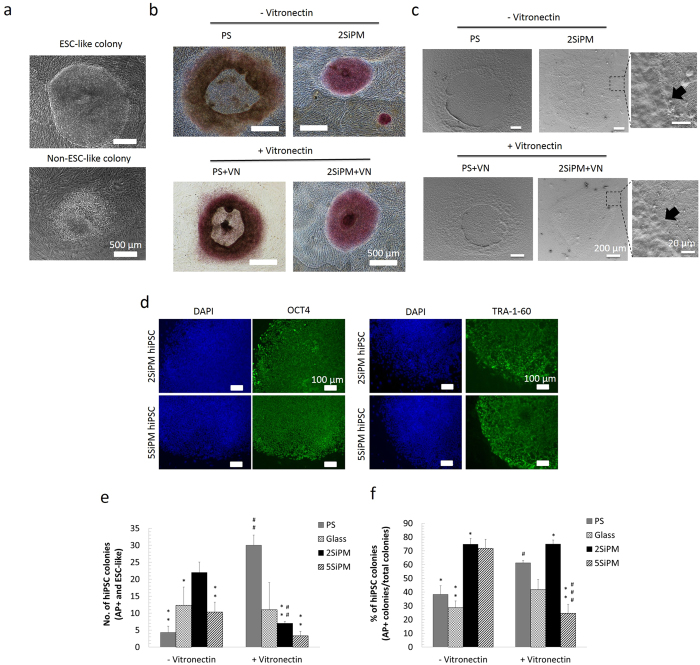
Figure 5. Assessment of cell reprogramming on BCCs.
(a) hESC-like colony morphology of fully reprogrammed hiPSC colonies (upper image) and partially reprogrammed cells, i.e. a non-hiPSC colony (lower image) under a standard reprogramming protocol. (b) Alkaline phosphatase (AP) staining of hiPSC colonies. Fully reprogrammed hiPSCs were found on 2SiPM while differentiated iPSC colonies were found on PS with and without a VN coating. (c) SEM images show the colony-surface interactions in detail, in particular the edge of the colonies and the particles underneath. (d) Immunocytochemistry of pluripotent markers OCT4 (left) and TRA-1-60 (right) in a clonal hiPSC line derived from culture on the 2SiPM or 5SiPM surfaces. (e) Quantification of the number of fully reprogrammed hiPSC colonies, and (f) the percentage of fully reprogrammed colonies (hiPSC colonies/total colonies). Noted that hiPSC colonies are defined as AP positive with a hESC-like morphology. Value = mean ± SEM (n = 3). *vs. positive control, i.e. PS+VN, and #vs. the same surface without a vitronectin (VN) coating at the same day. One, two, and three symbols indicate p < 0.05, 0.01, and 0.001, respectively.

