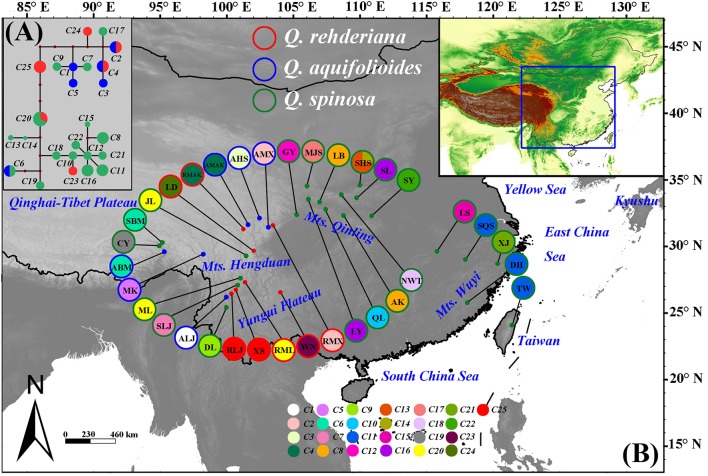
Figure 1.
(A) Network of the chloroplast (cp) DNA haplotypes detected in three oak species. Different species are denoted by different colors of the circle, each sector of a circle is in proportional to the frequency of each chlorotype. (B) Geographic distribution of the chloroplast (cp) DNA haplotypes detected in three oak species. Haplotype frequencies of each population are denoted by the pie charts with population IDs in the circle. Green, blue and red dots indicate the sample locations of Quercus spinosa, Q. aquifolioides, and Q. rehderiana, respectively.

