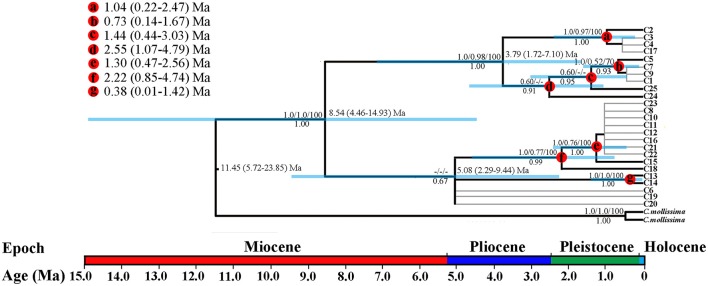
Figure 2.
BEAST-derived chronograms of three oak species based on cpDNA (psbA-trnH, psbB-psbF, and matK) sequences. Blue bars indicate the 95% highest posterior density (HPD) credibility intervals for node ages (in Myr ago, Ma). Bootstrap values (>50%) based on ML, MP, and BI analysis and posterior probabilities are labeled above and below nodes, respectively. Mean divergence dates and 95% HPDs for major nodes (a–g) are summarized in the upper left figure.

