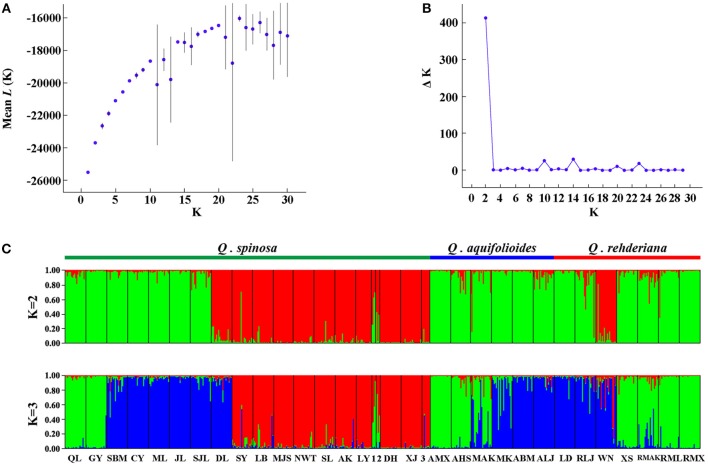
Figure 3.
Bayesian inference analysis of microsatellite data for determining the most likely number of clusters (K) for the three species. The distribution of the likelihood L(K) values (A) and ΔK values (B) are presented for K = 1–30 (10 replicates). STRUCTURE plots (C) are presented for best K = 2 and K = 3, respectively (1 = SHS; 2 = LS; 3 = SQS).

