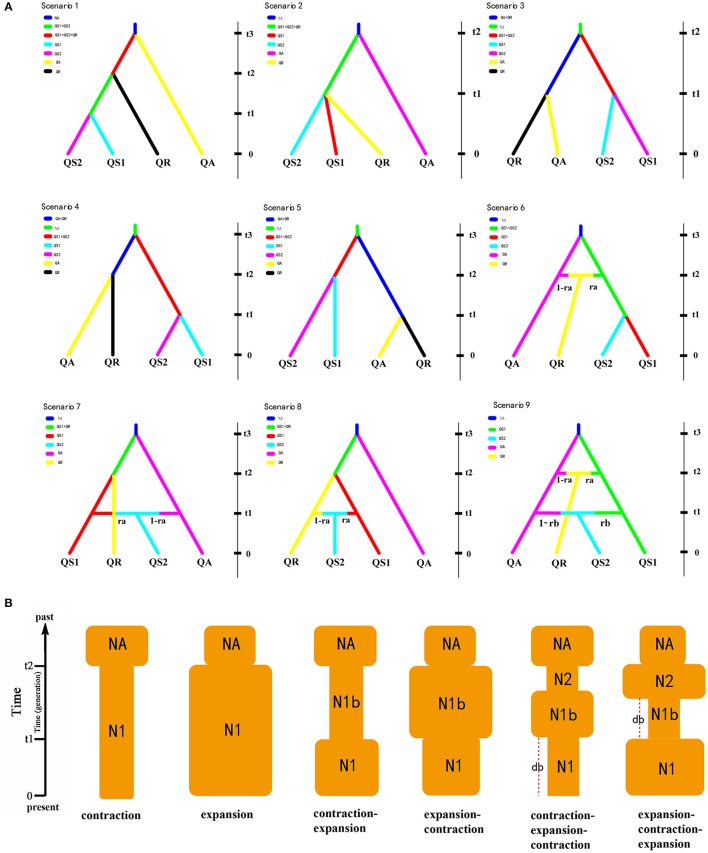
Figure 4.
(A) The nine scenarios of the population history of three oak species in DIYABC V2.04. QS1 and QS2 represent two groups of Quercus spinosa; QA and QR represent Q. aquifolioides and Q. rehderiana, respectively. The current population sizes of QS1, QS2, QA, and QR were denoted as NQS1, NQS2, NQA, and NQR, respectively, while NA represents the population size of the ancestral lineage at time t3 (or t2). t1–t3, divergence times for the depicted event. (B) Schematic representation of six demographic models of changes in population size tested within three oak species (Quercus spinosa, Q. aquifolioides, and Q. rehderiana) using DIY-ABC. NA, ancestral population size; N1, current population size; N1b and N2, populations sizes between NA and N1; db, duration of bottleneck.

