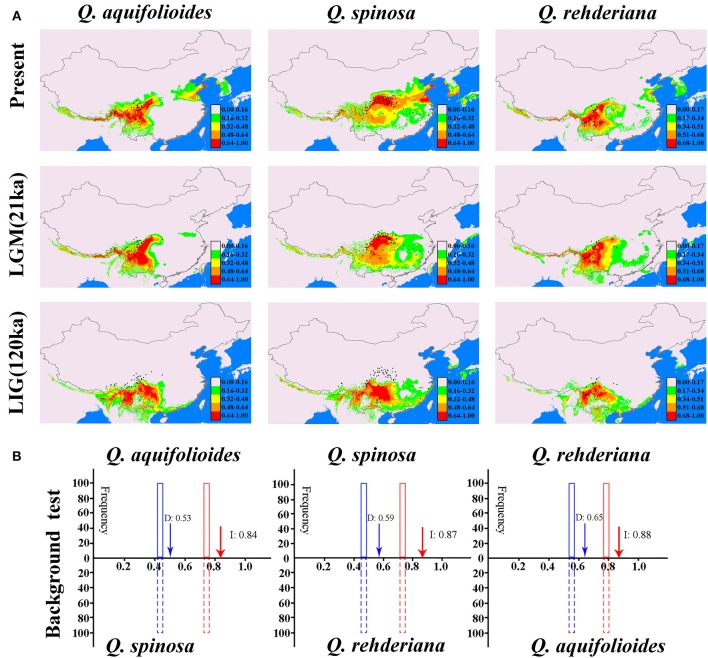
Figure 5.
(A) Predicted distributions of Quercus aquifolioides, Q. spinosa, and Q. rehderiana based on ecological niche modeling using MAXENT, black dots indicate extant occurrence points. (B) The background tests between different pairs of species. Null distributions are shown by dotted blue bars for D and solid red bars for I. The x-axis indicates values of I and D, and y-axis indicates number of randomizations. Red and blue arrows indicate values in actual MAXENT runs, respectively.

