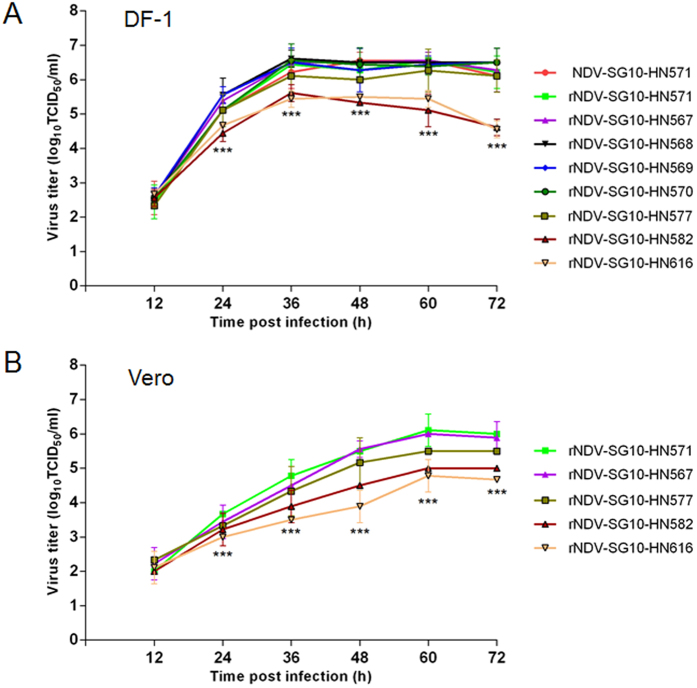
Figure 2. Growth characteristics of recombinant NDVs.
Multiple-cycle growth kinetics were used to assess the differences in the growth of these viruses. (A) DF-1 cells were infected with rNDV-SG10-HN571, rNDV-SG10-HN567, rNDV-SG10-HN568, rNDV-SG10-HN569, rNDV-SG10-HN570, rNDV-SG10-HN577, rNDV-SG10-HN582, or rNDV-SG10-HN616 at an MOI of 0.01 PFU/cell, and assayed as described in the Methods. (B) Vero cells were infected with rNDV-SG10-HN571, rNDV-SG10-HN567, rNDV-SG10-HN577, rNDV-SG10-HN582, or rNDV-SG10-HN616 at an MOI of 0.01 PFU/cell, and assayed as described in the Methods. Briefly, supernatant samples were collected at 12-h intervals for 72 h, and the viral titers were determined with a TCID50 limiting dilution assay, and calculated with the method of Reed and Muench. Means and standard deviations were shown from three independent experiments. Asterisks indicate the significance of the difference between the recombinant viral titer and the parental viral titer. P values were calculated with Tukey’s test (95% confidence levels). ***p < 0.001, extremely significant.

