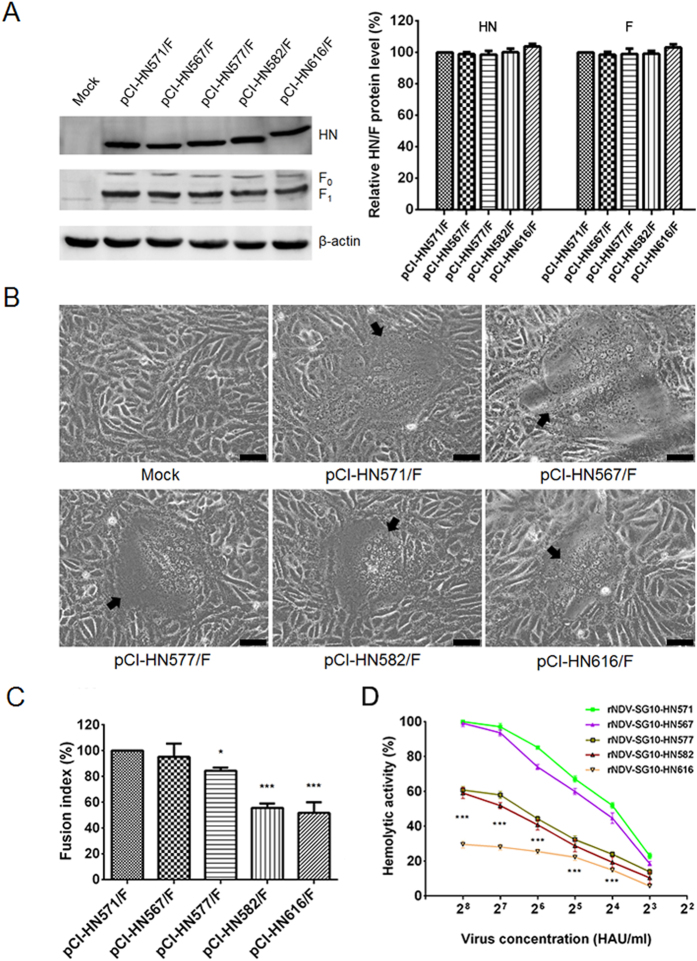
Figure 6. Syncytium formation in Vero cells co-transfected with expressed plasmids and hemolytic activities of parental or recombinant viruses.
(A) The amount of each HN or F (F0 and F1) protein was determined by western blot analysis at 48 h post-transfection of Vero cells by using anti-SG10 serum or anti-NDV F rabbit polyclonal antiserum. (B) At 48 h post-transfection, Vero cell monolayers that had been co-transfected with 1 μg each of pCI-F and pCI-HN mutant plasmids in six-well plates were digitally photographed under an inverted microscope (IX73; Olympus) at ×100 magnification. Black arrows indicate syncytia. Bar = 50 μm. (C) The fusion index values of these HN mutants were calculated as the ratio of the total number of nuclei to the number of cells in which the nuclei were observed. All values are expressed relative to the value for pCI-HN571/F (100%). (D) The hemolytic values for all the viruses were expressed as percentages of the values for rNDV-SG10-HN571 at 28 hemagglutination unit/ml, which were considered to be 100%. Each bar represents the mean and standard deviation of three independent experiments. Asterisks indicate the significance of the difference between the fusion index of a recombinant virus and that of the parental virus. P values were calculated with Tukey’s test (95% confidence levels). *p < 0.05, significant; ***p < 0.001, extremely significant.

