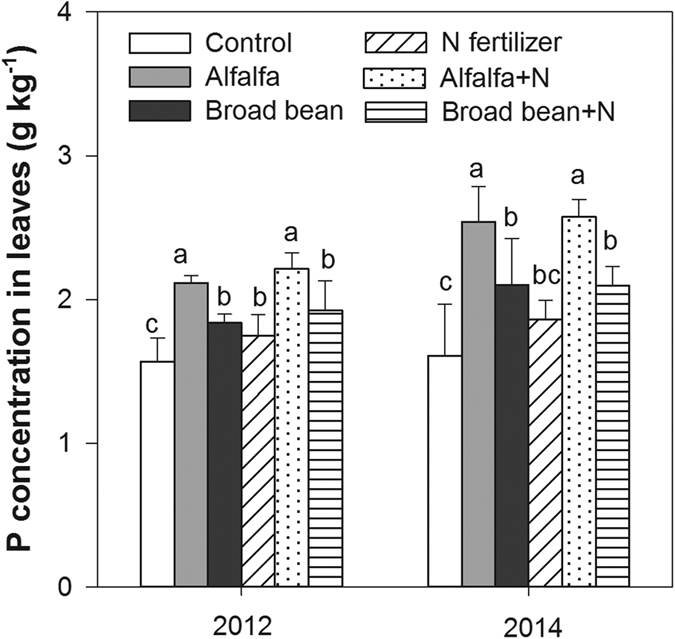
Figure 4. Average P concentrations in leaves during the rice tillering, panicle, and filling stages under the following treatments: control (no application), alfalfa (3000 kg DM ha−1), broad bean (3000 kg DM ha–1), N fertilizer (200 kg N ha−1), combined treatment of alfalfa (3000 kg DM ha−1) and N fertilizer (200 kg N ha−1) (alfalfa + N), and combined treatment of broad bean (3000 kg DM ha−1) and N fertilizer (200 kg N ha−1) (broad bean + N) in 2012 and 2014.

In the same year, the bars with different letters are significant (P < 0.05). Data are means ± standard errors.
