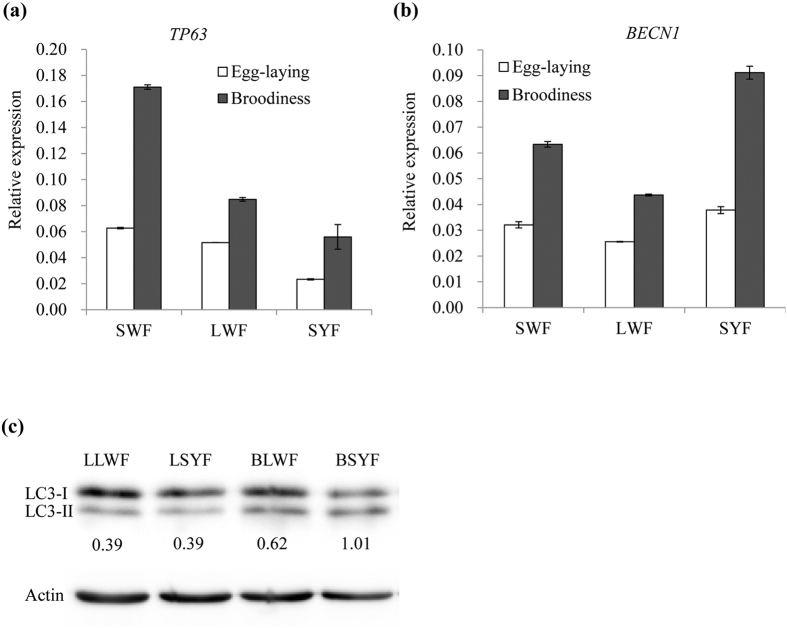
Figure 6. Analysis of autophagy levels in goose follicles.
(a) Validation of the different expression of TP63 by qRT-PCR. (b) Validation of the different expression of BECN1 by qRT-PCR. (c) Analysis of autophagic marker LC3 protein in SWF, LWF and SYF from egg-laying and broody geese using Western blot method.

