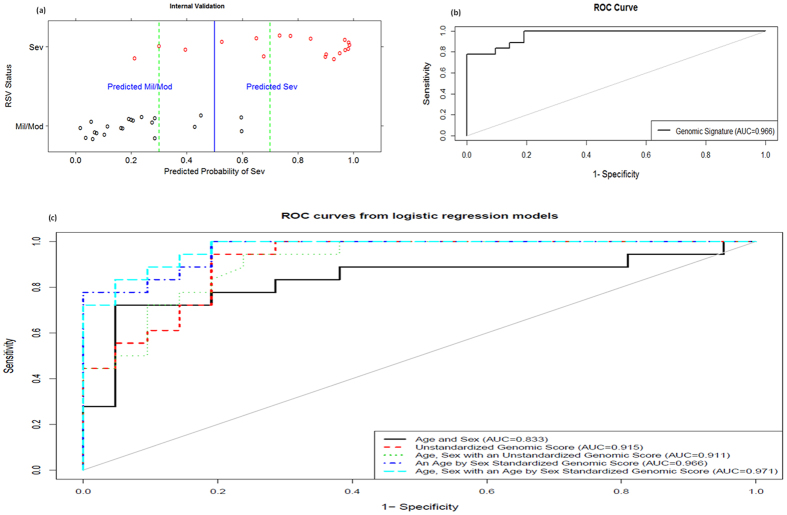
Figure 4. Internal validation of gene signature.
(a) samples’ predicted probabilities of being severe. (b) shows the ROC curve and the AUC for predicted probabilities. The AUC value of approximately 1 indicates how accurate our signature performs on this internal validation set. (c) shows that a genomic model from the age by sex standardized data out performs that from the unstandardized data. In addition, there is a significant difference between a model with clinical parameters and that with a genomic score and just a slight improvement when both parameters are included in a model.

