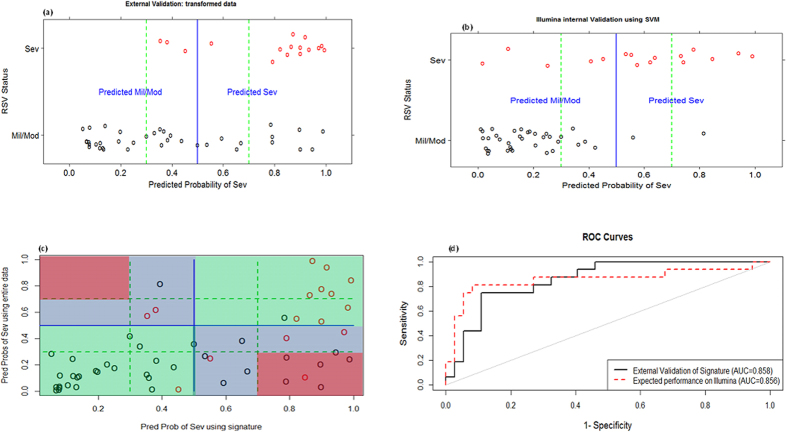
Figure 5.
Predicted probabilities of being severe from the validation data against true RSV status using; our diagnostic signature (a) and LOOCV on unrestricted data (b). (c) illustrates the agreement of the predictions from both models, green regions are perfect agreement, blue are disagreements at a 50% cutoff and red are disagreements at a 30–70% uncertainty band. Finally, (d) presents the ROC curves and AUC from both models illustrating similar AUC values.

