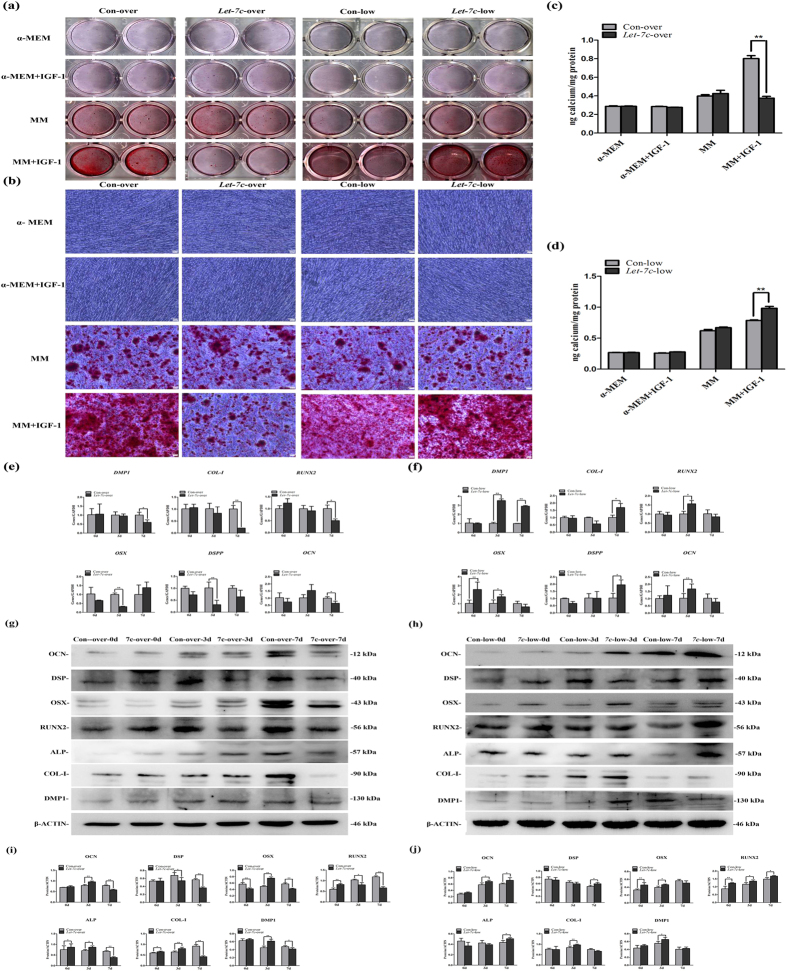
Figure 4. IGF-1/IGF-1R/hsa-let-7c axis can regulate the odonto/osteogenic differentiation of SCAPs.
(a) Alizarin red staining for control group, insulin-like growth factor-1 (IGF-1) group, mineralization-inducing media (MM) group and MM+IGF-1 group at day 14, respectively. (b) Calcium nodules in different groups under the inverted microscope. Scale bars = 100 μm. (c) Quantitative analysis for calcium contents in the Let-7c-over group. Values were the means ± SD, n = 3. **P < 0.01. (d) Quantitative analysis for calcium contents in the Let-7c-low group. Values were the means ± SD, n = 3. **P < 0.01. (e) Real-time RT-PCR analysis for the expression of DMP-1, COL-I, RUNX2, OSX, DSPP and OCN in Con-over group and Let-7c-over group respectively. (f) Real-time RT-PCR analysis for the expression of DMP-1, COL-I, RUNX2, OSX, DSPP and OCN in Con-low group and Let-7c-low group respectively. Values were described as the means ± SD, n = 3. **2−∆∆Ct > 2, P < 0.01; *1 < 2−∆∆Ct < 2, P < 0.01. (g) Western blot assay for the odonto/osteogenic proteins (OCN, DSP, OSX, RUNX2, ALP, COL-I and DMP1) in Con-over group and Let-7c-over group respectively. (h) Western blot assay for the odonto/osteogenic proteins (OCN, DSP, OSX, RUNX2, ALP, COL-I and DMP1) in Con-low group and Let-7c-low group respectively. (i) Quantitative analysis for western blot results in Con-over group and Let-7c-over group respectively. Values were described as the means ± SD, n = 3. *P < 0.05, **P < 0.01. (j) Quantitative analysis for western blot results in Con-low group and Let-7c-low group respectively. Values were described as the means ± SD, n = 3. *P < 0.05, **P < 0.01.

