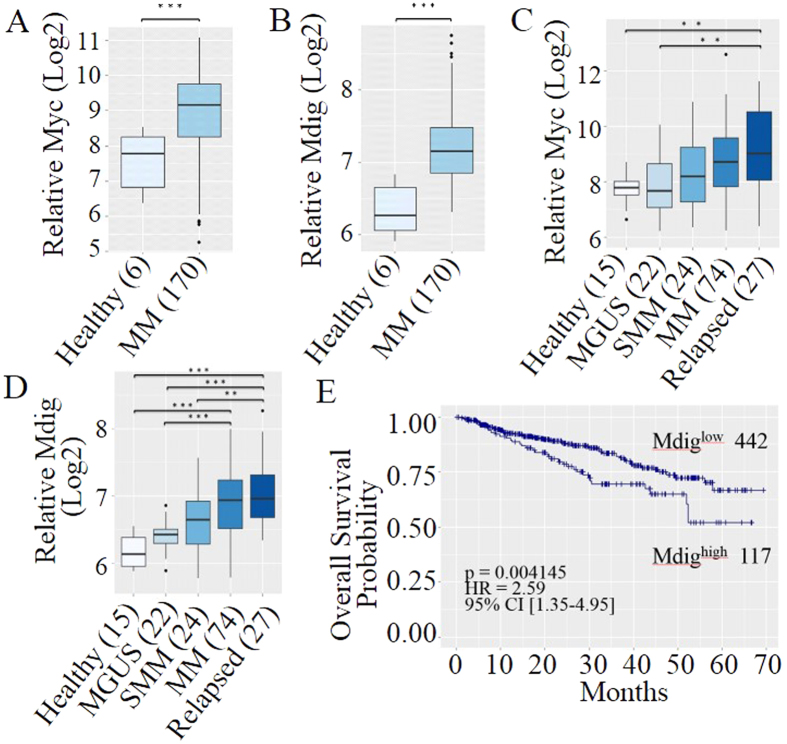
Figure 3. Overexpression of mdig and c-myc is associated with disease progression and poor prognosis of MM.
(A) Box plot of relative level of c-myc mRNA in newly diagnosed MM patients and healthy donors (GES39754, n = 176); (B) Box-plot of relative level of mdig in newly diagnosed MM patients and healthy donors (GES39754, n = 176); (C) Expression level of c-myc mRNA in CD138+ plasma cells from healthy donors and MM patients at various stages (GSE6477, n = 163); (D) Expression level of mdig mRNA in CD138+ plasma cells from healthy donors and MM patients at various stages (GSE6477, n = 163). In the plots, boxes denote the inter-quartile range (25% to 75%), bars represent medians and whiskers indicate up to 1.5 × the inter-quartile range that covers 95% of all samples. Outliers are indicated by the black dots. Sample sizes of each group are annotated in parentheses and expression levels are displayed in log 2 scale. (***p < 0.001, **p < 0.01). (E) Kaplan-Meier (KM) survival curve of 559 MM patients (GSE2658) stratified by their mdig expression levels. Sample sizes of each group, log-rank p-value, hazard ratio and 95% confidence intervals are displayed in the figure. Tick marks on each arm represent censored samples.

