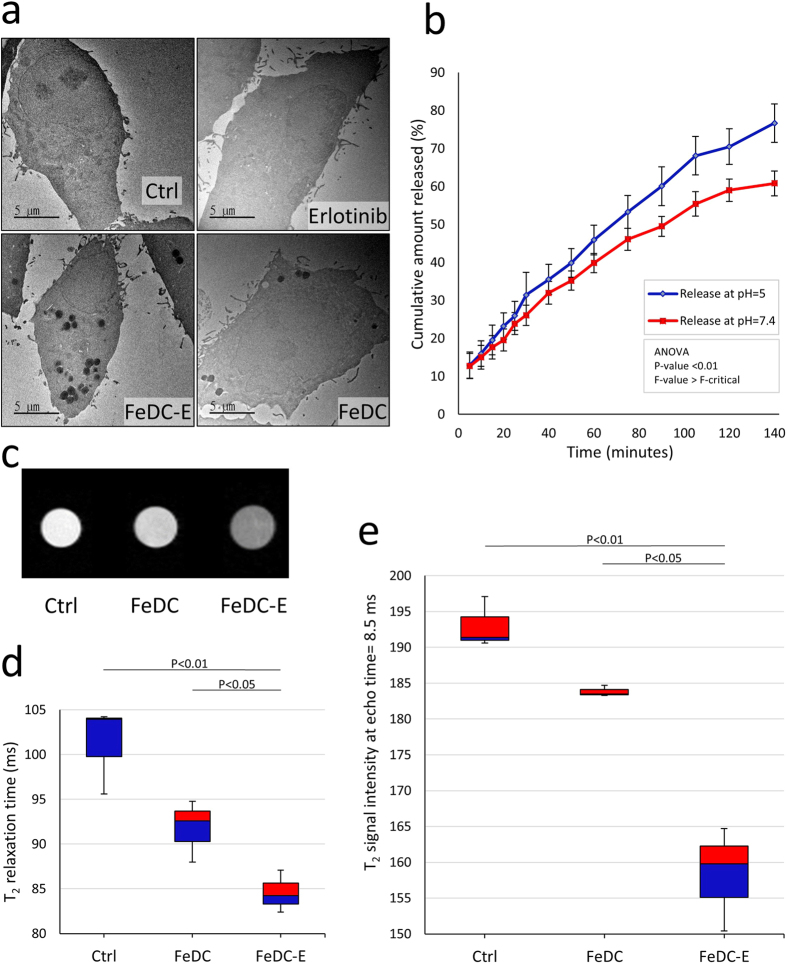
Figure 4. Targeted cellular uptake of nanoparticles, MRI contrast enhancement of the nanoparticles-labeled cells, and smart release system of erlotinib from nanoparticles.
(a) Transmission electron microscopy images of CL1-5-F4 cells showing cellular uptake of nanoparticles. Nanoparticles are visible as electron-dense regions within endocytotic vesicles. The FeDC-E NPs-treated cells showed increased cellular uptake of nanoparticles compared to the FeDC NPs-treated cells due to the targeting capability of erlotinib to EGFR imparted to the FeDC-E nanoparticles. (b) Release profiles of erlotinib from the erlotinib-conjugated nanoparticles (FeDC-E NPs) in the extracellular environment mimicking fluid (pH = 7.4) and intracellular endocytotic mimicking fluid (pH = 5) at 37 °C. The FeDC-E NPs showed preferential release of erlotinib into the endocytotic mimicking fluid with a higher rate than into the extracellular mimicking fluid. (c) T2-weighted MRI images of CL1-5-F4 cells post-treatment with the nanoparticles. (d) Corresponding T2 relaxation times presented in a box plot. (e) Corresponding T2 signal intensities at 8.5 ms echo time where the difference in intensities between groups were maximum, presented in a box plot. FeDC-E NPs produced significant decrease of the MRI relaxation times and the MRI signal intensities of treated cells compared to the non-targeted control nanoparticles (FeDC NPs). The P-values for (d,e) were calculated using the t-Test method assuming unequal variances. Ctrl: non-treated cells, FeDC: cells treated with dextran-coated iron oxide nanoparticles and FeDC-E: cells treated with the erlotinib-conjugated dextran-coated nanoparticles.

