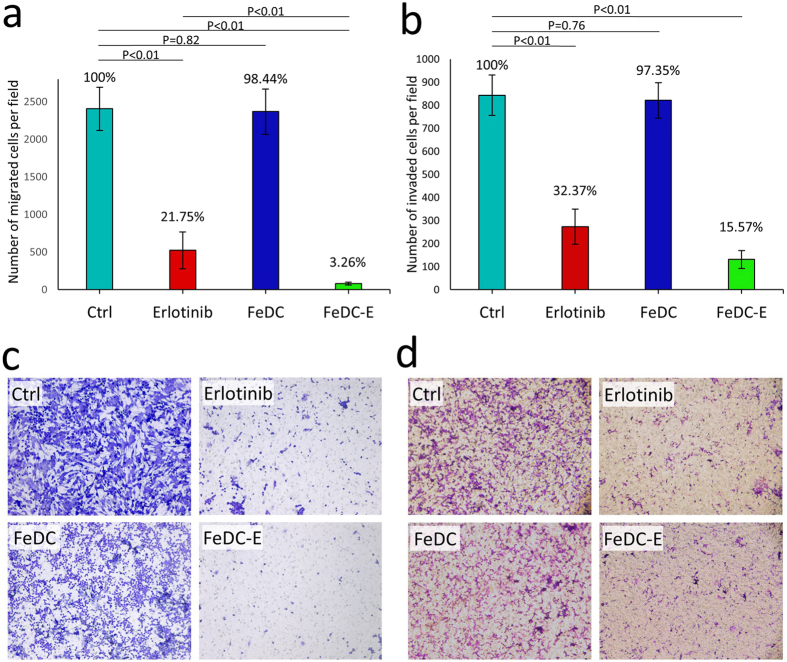
Figure 6. Migration and invasion of CL1-5-F4 cells.
(a) Migration of CL1-5-F4 cells tested by the transwell assay, and presented as percentages of migrated cells. (b) Invasion of CL1-5-F4 cells tested by the Matrigel transwell assay, and presented as percentages of invaded cells. (c) Microscopical images of the cells migrated to the lower side of the membrane. (d) Microscopical images of the cells invaded through the Matrigel to the lower side of the membrane. Treating cancer cells with either FeDC-E NPs or erlotinib significantly inhibited the migration and invasion capabilities of cells. FeDC-E NPs showed more inhibition activities than erlotinib. (Ctrl) non-treated cells, (FeDC) cells treated with dextran-coated iron oxide nanoparticles, (FeDC-E) cells treated with the erlotinib-conjugated dextran-coated nanoparticles. Percentages of the migrated and invaded cells were quantified using ImageJ software, and the P-values were calculated using the t-Test method assuming unequal variances.

