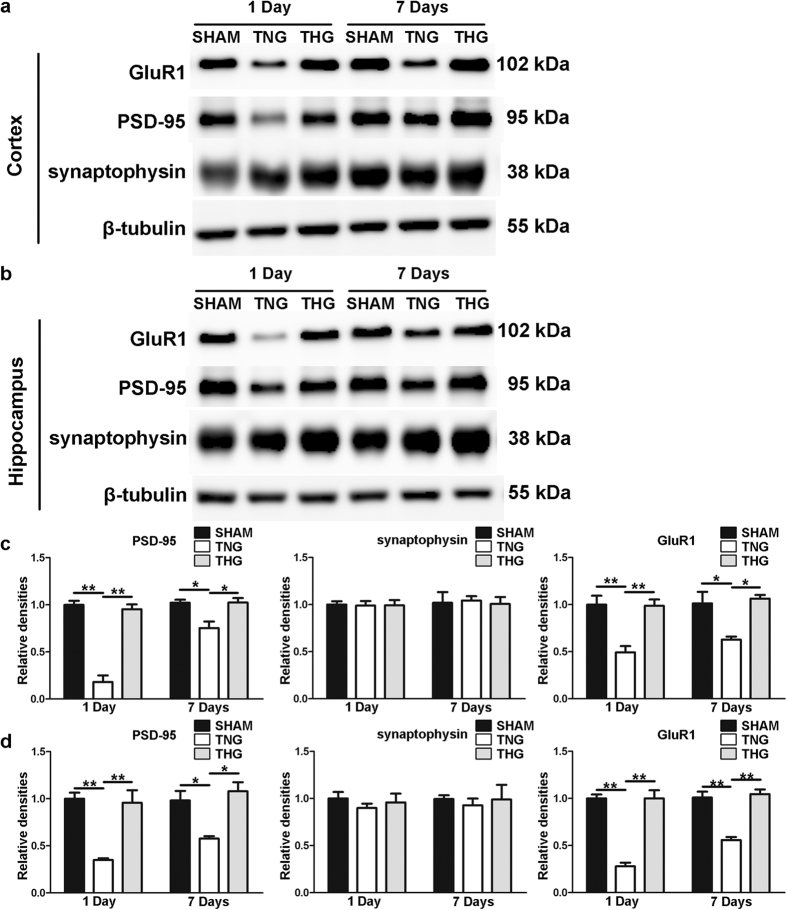
Figure 6. Temporal profile of synaptic proteins expression after severe TBI.
(a) Western blot analysis was performed to evaluate the PSD-95, synaptophysin and GluR1 expression levels in the cortex 1 and 7 days after injury. (b) Western blot analysis was performed to evaluate the PSD-95, synaptophysin and GluR1 expression levels in hippocampus 1 and 7 days after injury. (c,d) Quantitative analyses of the PSD-95, synaptophysin and GluR1 expression levels in the cortex and hippocampus were performed. The results of these analyses were normalized to β-tubulin levels. The data are represented as means ± SEM and analysed using a one-way analysis of variance (ANOVA) followed by Tukey’s post hoc test, n = 10, **p < 0.01, THG or sham vs. TNG. TNG, the traumatic brain injury with normothermia group; THG, the traumatic brain injury with hypothermia group.

