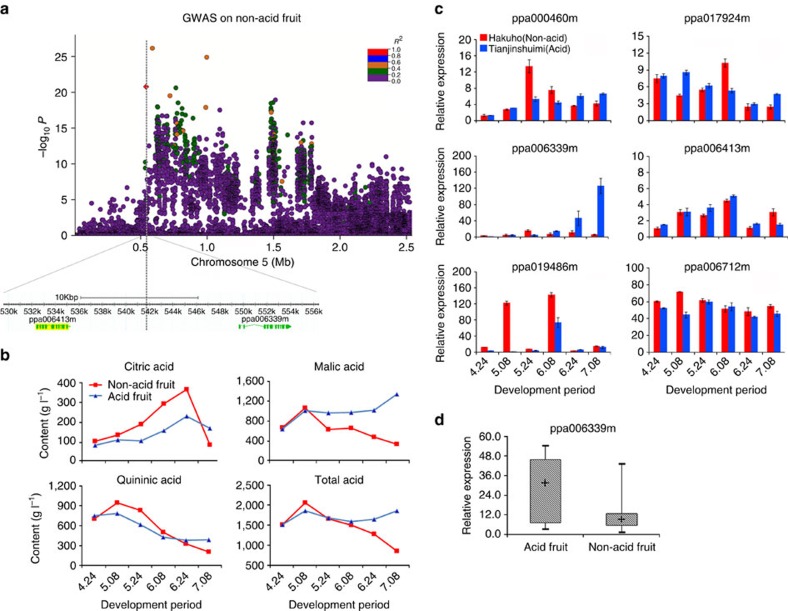
Figure 2. Association results for the non-acid fruit trait and expression profiles of candidate genes in peach.
(a) Location of the locus associated with the non-acid fruit trait identified on scaffold_5 using the GLM-PCA model. Legends and colour codes for r2 are the same as described in Fig. 1. (b) Variation in citric acid, malic acid, quininic acid and total acid contents during the development of acid and non-acid peach accessions. (c) Relative expression of the six genes associated with acid and non-acid peach accessions (indicated in different colours), as quantified by qRT–PCR. (d) Relative expression of the candidate gene ppa006339m in the mature fruits of nine acid and 15 non-acid accessions. Values represent mean±s.d. of triplicates for qRT–PCR in each sample.

