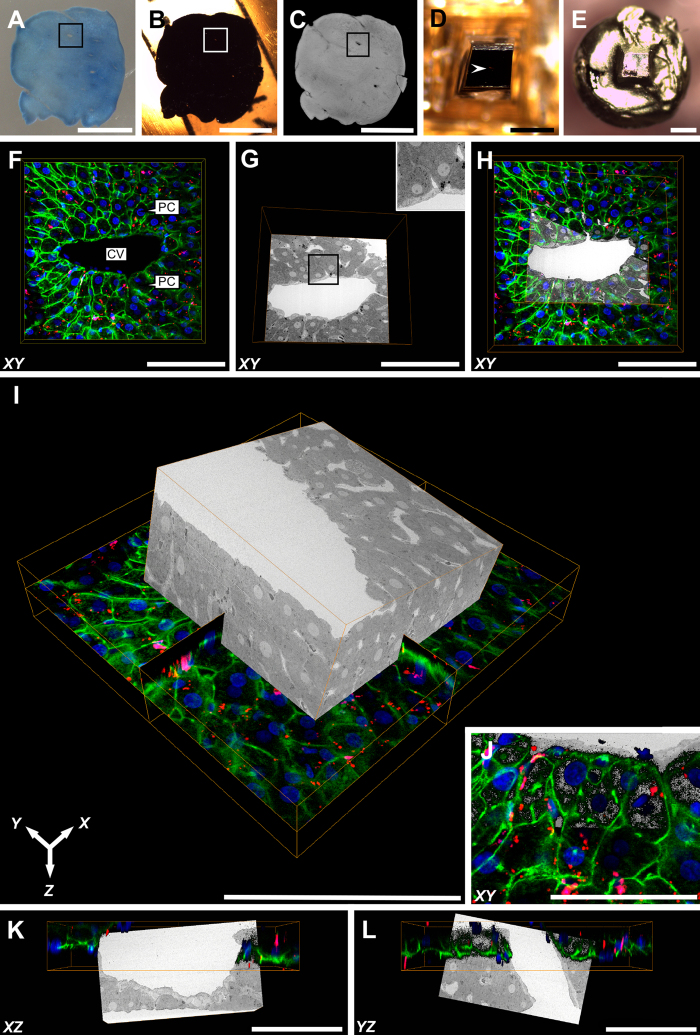
Figure 6. Three-dimensional CLEM: combining CLSM and SBF-SEM datasets.
(A) Vibratome section of rat liver tissue proceeding CLSM imaging. The blue colour of the tissue is attributable to the histological staining properties of Nile Blue. Of particular note, Nile Blue produces red emission (see images F and H-L) when excited with 790 nm multiphoton excitation. The ROI (large vein) is indicated by a black bounding box. Conveniently, the scanned ROI appeared lighter in colour after CLSM imaging, relative to the surrounding tissue, assisting with relocation for subsequent correlation. (B) Epon-embedded sample prepared under the NCMIR protocol. The ROI corresponding to (A) is indicated by a white bounding box. (C) 3-D reconstructed x-ray micro-CT data, aiding in the confirmation of the ROI (black bounding box). (D) Precision trimmed epon block that has been centred, relative to the ROI (white arrowhead). (E) Gold coated sample, adhered to the specimen pin in preparation for SBF-SEM imaging. (F) XY confocal image showing a large central vein (CV) surrounded by plates of parenchymal cells (PC). The filamentous actin network predominantly underlying the plasma membrane is visible in green, nuclei appear blue and lipid droplets appear as red punctate or spherical structures distributed throughout the cell cytoplasm. (G) 2-D SBF-SEM image corresponding to the same area as shown in (F). A far more extensive array of structures are visible relative to (F), such as the hepatic sinusoids branching toward the central vein. (G-inset) Higher-magnification SBF-SEM image illustrating the high resolution capabilities of the SBF-SEM system. (H) Overlay of (F,G). (I) Overlayed 3-D representation of both CLSM and SBF-SEM volumes. (J) XY high-magnification overlay of CLSM and SBF-SEM datasets. (K,L) XY and YZ CLSM and SBF-SEM overlays. Scale bars: (A–C) = 3 mm; (D,E) = 700 μm; (F–L) = 100 μm.

