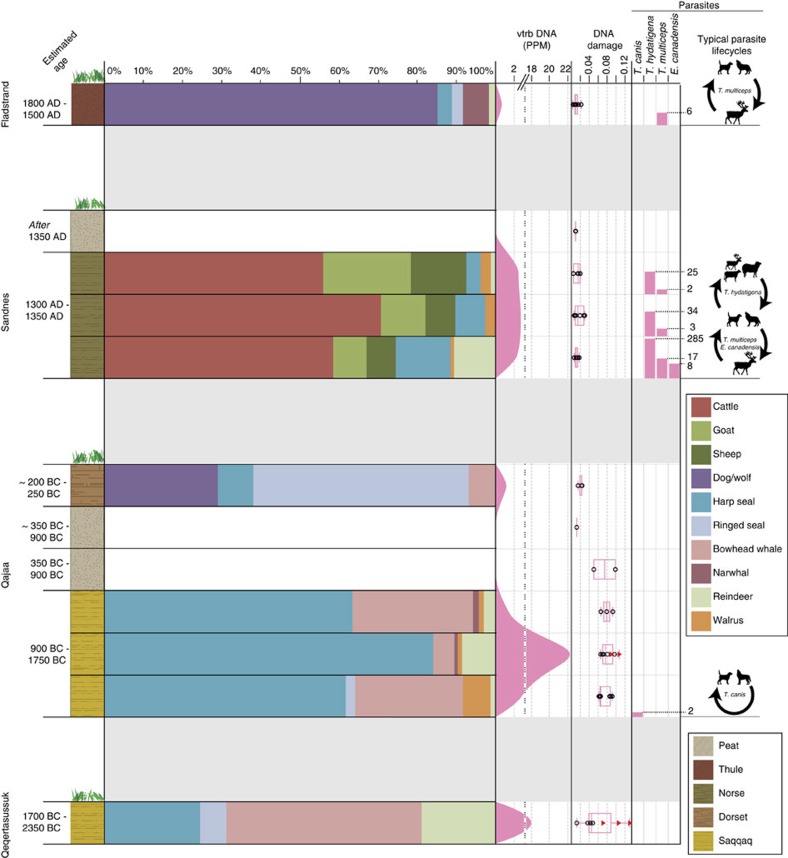
Figure 2. 4000 years of resource economy in Greenland.
Barplots represent relative abundances of the 10 most common mammal species identified across all sites (Supplementary Table 1). In cases where higher-order taxa could be uniquely identified to a single species, reads were collapsed to species level (outlined in Methods). Vertebrate DNA concentration is defined as vertebrate DNA reads per million reads analysed (Supplementary Table 12). DNA damage patterns are illustrated by the frequency of C to T transitions in the first 5′ position. Open circles represent DNA damage from plant species while red triangles represents mammal DNA damage. DNA damage calculations are based on species represented by more than 500 reads. Parasite read counts represent DNA reads assigned uniquely to the given parasite (Supplementary Table 3). At Qajaa the two uppermost layers represent profile B, while the four layers below represent profile A. Graphics credits: Dog silhouette by Abujoy/CC BY. Cattle silhouette from clipartkid. Caribou silhouette by mystica/CC.

