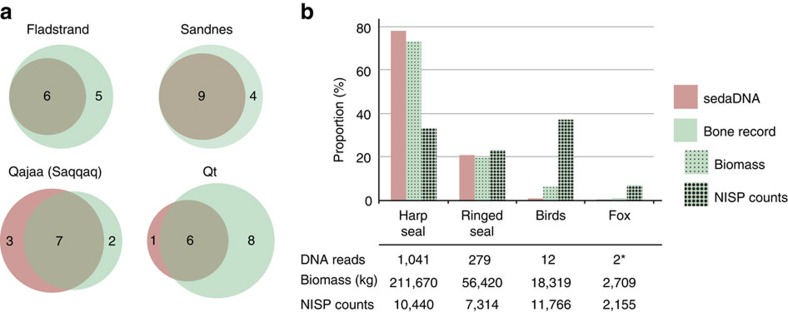
Figure 3. Comparison of biodiversity as identified by sedaDNA and zooarchaeological excavations.
(a) Number of mammals unambigously identified by sedaDNA and in the bone records. (b) Relative proportions of the four most common groups identified in the bone record from Qeqertasussuk5 compared with DNA read counts from Qeqertasussuk (Methods, Supplementary Table 7). *Reads identified, although not included in the quantification analyses due to low read counts.

