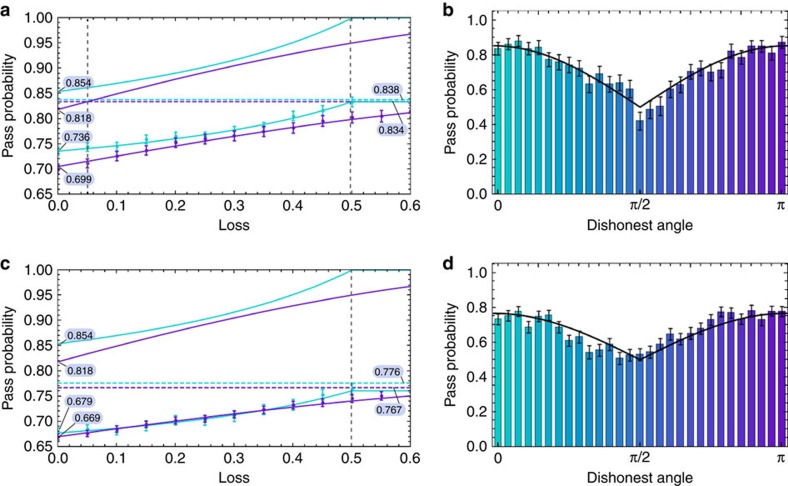
Figure 3. Pass probabilities as a function of loss for one dishonest party in a three- and four-party setting.
(a,b) correspond to the three-party setting, and (c,d) correspond to the four-party setting. The upper curves in a and c show the ideal theoretical case for the GME bound for the θ-protocol (purple curve) and a cheating strategy for the XY-protocol (turquoise curve) that always performs better. Note that the XY-protocol cannot be used here for verification as the non-GME dishonest value is always above the honest value. The lower solid curves in a and c correspond to the experimental results obtained for the three- and four-photon GHZ state, respectively. In both panels, the dashed lines correspond to the honest experimental values when there is no loss (turquoise for the XY-protocol and purple for the θ-protocol). (a,c) clearly show that the θ-protocol can tolerate loss ⪆0.5 in the ideal case. (b,d) show the optimal pass probability that the dishonest party can obtain when running the θ-protocol with no loss, for a given dishonest angle θ, for the three-party and four-party case, respectively. In all plots, the curves are a best fit to the data. All error bars represent the standard deviation and are calculated using a Monte Carlo method with Poissonian noise on the count statistics28.

