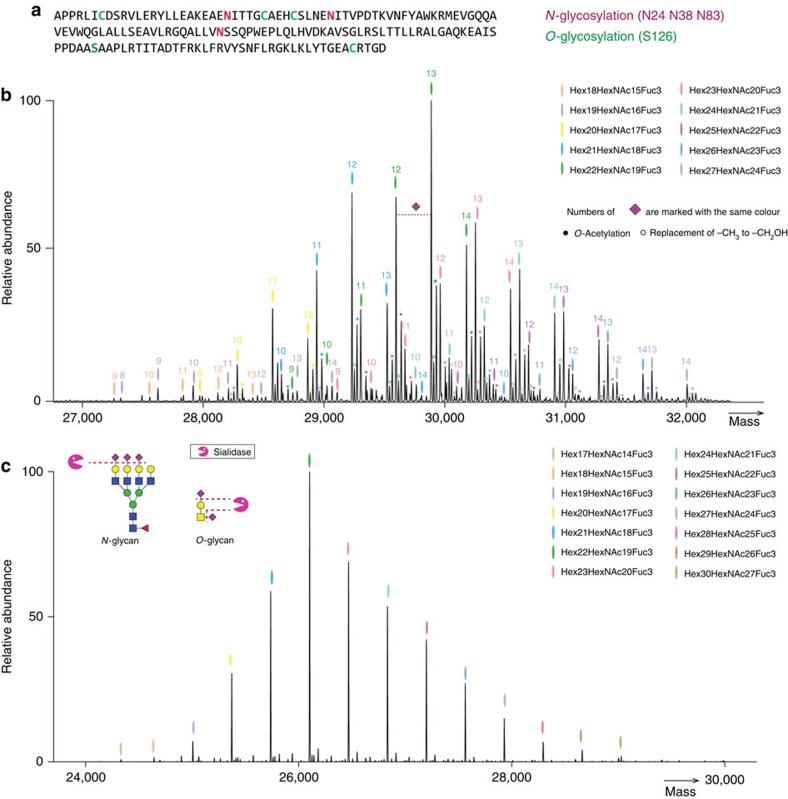
Figure 2. Native MS analysis of rhEPO.
(a) Schematic of the rhEPO backbone sequence and its reported PTM sites (Uniprot code: P01588). (b) The zero-charge deconvoluted native MS spectrum of rhEPO. The overall PTM compositions are assigned based on the accurate mass measurements of the intact protein. Each colour represents a glycan composition without sialic acids; the number of sialic acids attached are marked on top of each peak with the same colour. For example, the most abundant peak are marked in green and number 13, it corresponded to the glycan composition Hex22HexNAc19Fuc3Sia13. The additional +42 Da modifications represent the further O-acetylation of sialic acids (shown in filled circles), whereas the +16 Da modification indicates the replacement of NeuAc for NeuGc (shown in empty circles). (c) The zero-charge deconvoluted native MS spectrum and the overall PTM composition assignments rhEPO subjected to treatment by sialidase, which cleaves off all sialic acids present on rhEPO.

