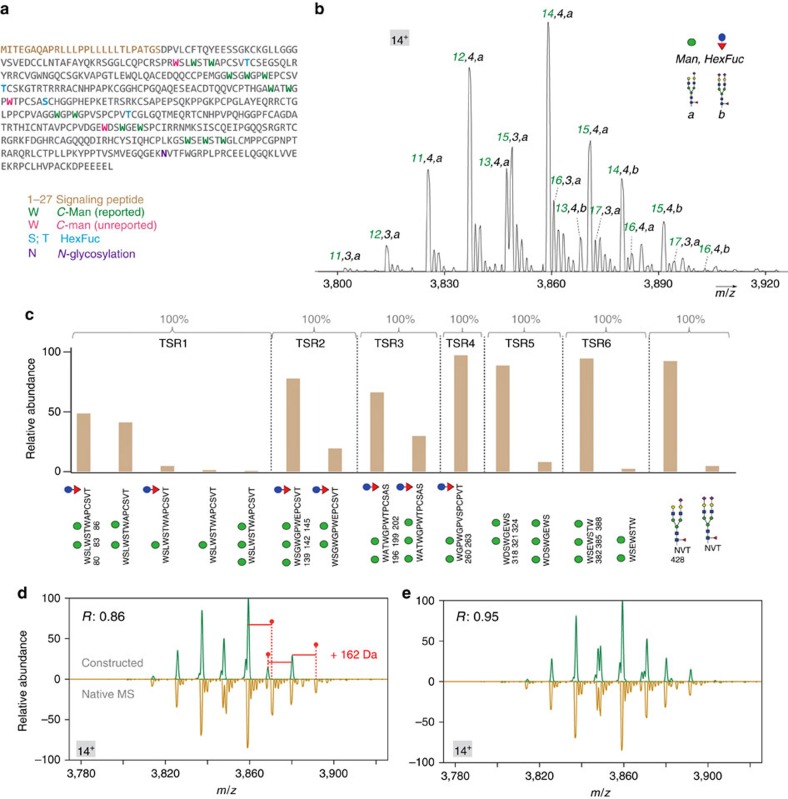
Figure 5. Comprehensive PTM characterization of properdin.
(a) The properdin sequence and its known and novel PTM sites, wherein the three newly discovered mannosylation sites at W80, W202 and W318 are annotated in red. (b) The native MS spectrum of properdin, zoomed in at charge state [M+14H]14+. The overall PTM composition is annotated. (c) Relative abundances of peptide proteoforms were estimated from their XICs. Each PTM-modified peptide was normalized individually so that the sum of all its proteoform areas was set at 100%. For clarity, only parts of the peptide sequence with PTMs are shown below the graph. A more detailed look at the graph in b shows a certain variability of C-mannosylation occupancy in different TSRs; details on this heterogeneity are described in Supplementary Note 1. (d,e) The comparison of the constructed spectra without (d) or with (e) the three newly discovered C-mannosylation sites with the experimental native MS spectrum of properdin. The Pearson correlation coefficient between the displayed spectra is shown at the top left.

