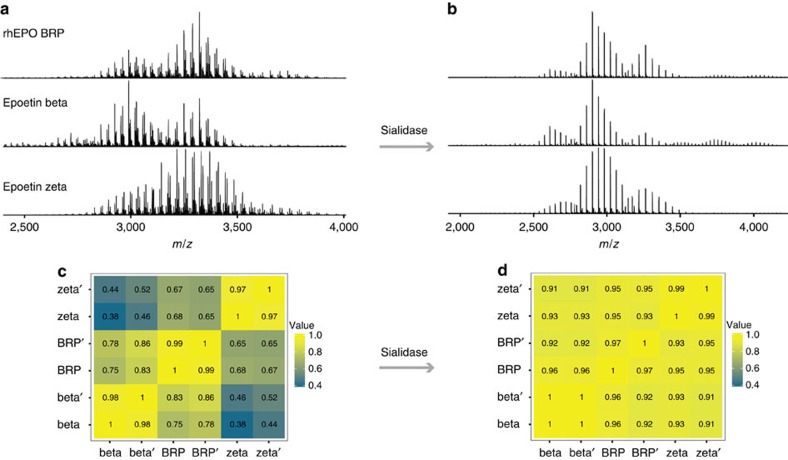
Figure 6. Quantitatively assessing the similarity of different rhEPO therapeutics using high-resolution native MS.
(a,b) Native MS spectra of three rhEPO products (rhEPO BRP, epoetin beta and epotein zeta) without (a) or with (b) sialidase treatment. (c) A heat map displaying spectra similarity between the three different rhEPO products. The numbers displayed in the heat map represent the Pearson correlation coefficients. Experimental duplicates are marked as beta and beta′, BRP and BRP′, zeta and zeta′. After removing sialic acids contents by sialidase, the Pearson correlation coefficients between EPO products increased, as shown in the heat map of desialylated EPO samples (d).

