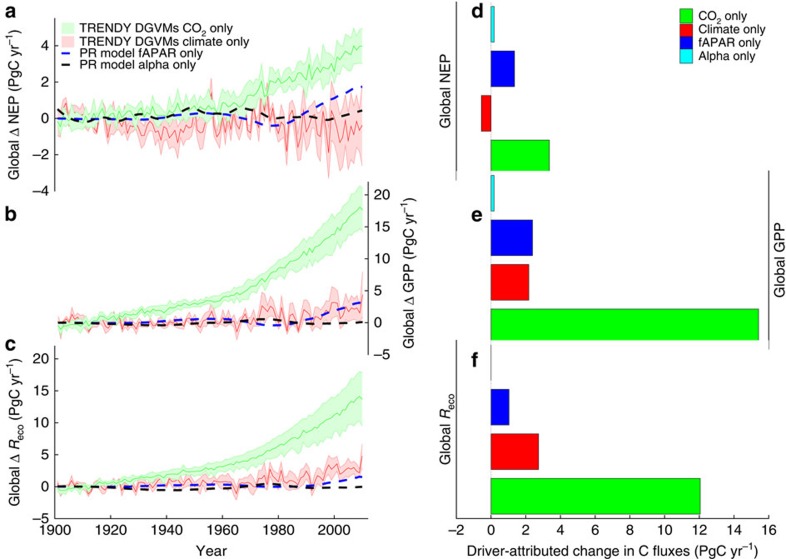
Figure 4. Contribution of different forcings to the long-term change in terrestrial carbon cycling.
Model estimates of the extent to which long-term changes in different forcing factors are responsible for the long-term change in net ecosystem production (NEP) (a,d), gross primary production (GPP) (b,e) and ecosystem respiration (Reco; c,f), where NEP=GPP−Reco. Shaded areas in a–c represent the mean and s.d. from the TRENDY ensemble of dynamic global vegetation model (DGVM) simulations with varying CO2 (green) or climate (red) only. Dashed lines in a–c show the effect of changes in vegetation (or the fraction of absorbed radiation (fAPAR), blue), and water availability (Alpha, black) estimated using a satellite-driven coupled photosynthesis-respiration (PR) model. (d–f) The mean change associated with each driver between the periods 1901–1915 and 1995–2010.

