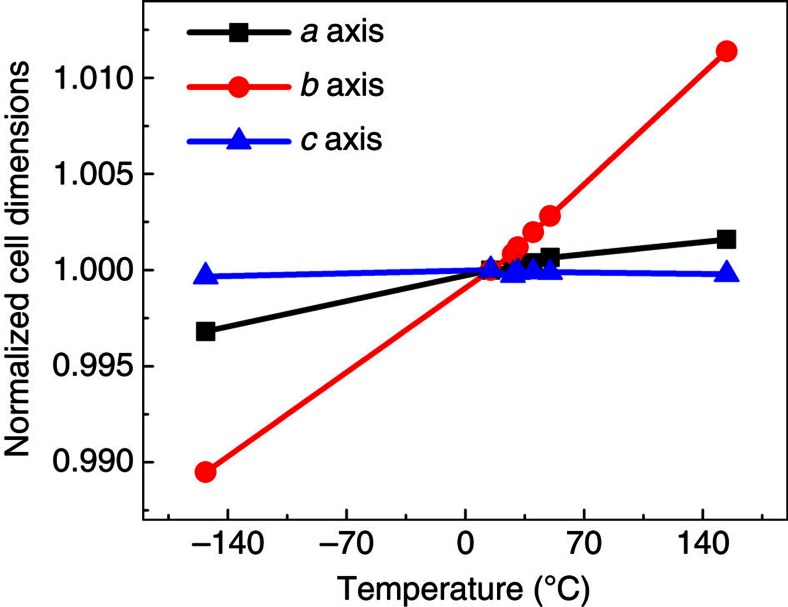
Figure 3. Temperature variation of α-glycine cell parameters.
The values are normalized with respect to those at 15 °C (figure is constructed from the data taken from ref. 22). The b axis strongly increases with temperature, a far greater change than the changes in the other lattice parameters.

