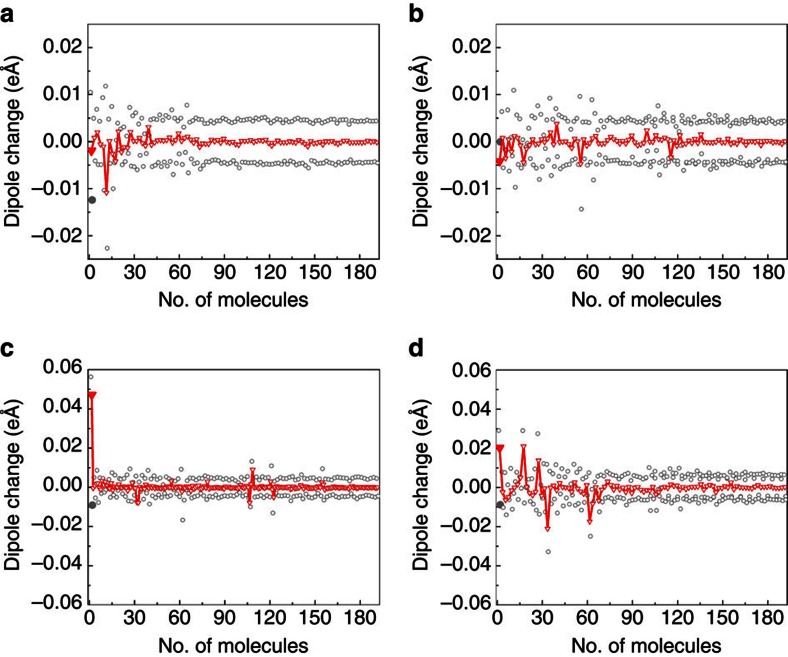
Figure 4. Dipole change of each molecule in the supercell.
Dipole change from 30 to 60 K of glycine doped with (a) L-alanine and (b) L-threonine. Dipole change of glycine doped with L-serine (c) from 30 to 60 K and (d) 100 to 130 K (note the different scales). The molecules are numbered from 1 to 192, where the dipole changes of the molecules are represented as empty grey circles and the dopant is marked as a filled grey circle. The molecules are sorted by distance from the dopant as D, L or D′, L′ pairs. The empty red triangles represent the total change in polarization of each pair, while the filled red triangle represents the dopant site (guest-glycine pair).

