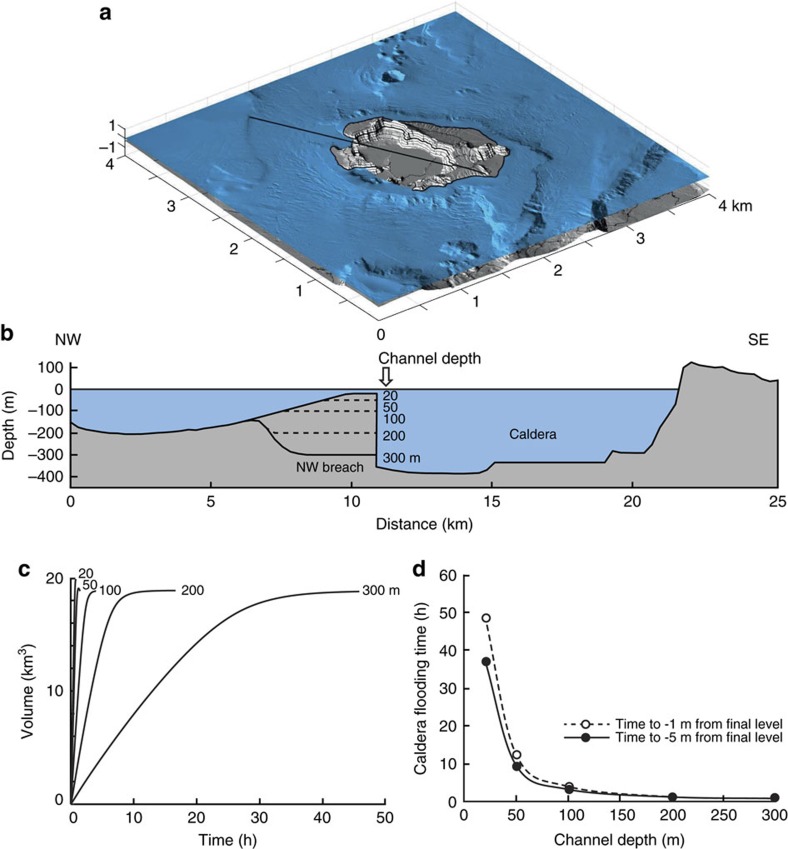
Figure 7. Numerical modeling of flooding.
Model set up and results for the flooding of the caldera resulting from the breach of the NW caldera wall. (a) Calculation domain for the numerical modelling, showing the initial (pre-flooding) conditions for the 20 m entry model presented in the Supplementary Movie 1. The black line represents the bathymetric profile shown in b. (b) Bathymetric profile along the traverse in a, showing the five different starting profiles with caldera-entry depths of 20, 50, 100, 200 and 300 m. The bathymetry was kept constant over the duration of each model. (c) Intracaldera sea water volume as a function of time for the five models. (d) Caldera filling time as a function of caldera-entry depth for final conditions of 5 and 1 m below sea level.

