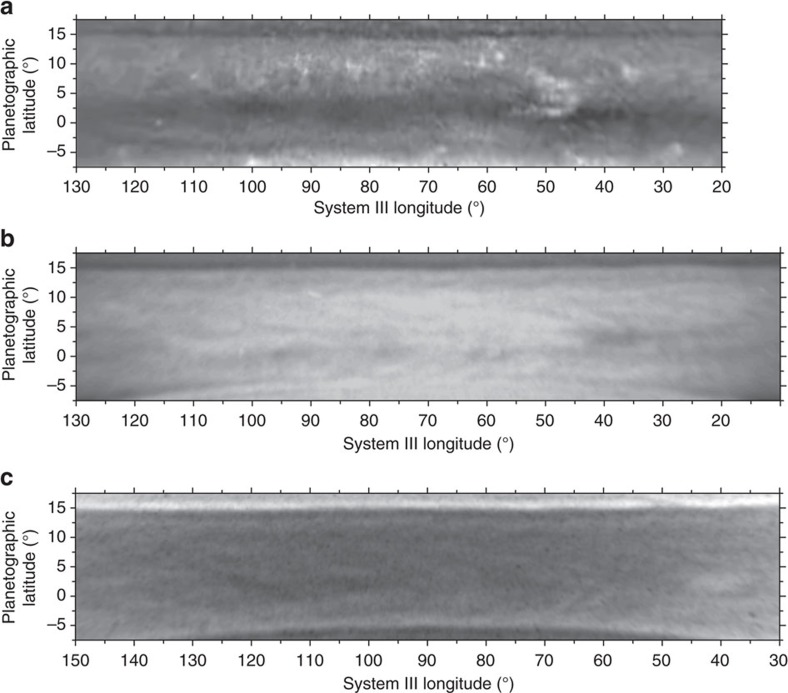
Figure 3. Maps of Saturn's Equator from Hubble Space Telescope.
The images were obtained with the WFC3 on 29 June 2015 at the following wavelengths: (a) 750 nm (red continuum); (b) 889 nm (methane band); (c) 336 nm (ultraviolet). Image details are given in Supplementary Table 2.

